In his book, Moore altered the original Mogul Flight #5 trajectory plot, making it appear that the flight missed and crashed much further from Roswell base than it really did. Actually it passed within a few miles of the base and likely was noticed by base personnel before the Roswell incident a month later. Moore in his book also neglected to mention how Roswell researcher Kevin Randle had originally
Moore pins his Flight #4 trajectory on ancient memories of the balloons being tracked near the "exotic" locales of Arabela and Bluewater, N.M., names he claims he never would have heard thereafter. But Flight #17, only 3 months later, passed right by these same locations. Is Moore
AP reporter Jason Kellahin was dispatched from Albuquerque to Roswell to cover the story on July 8, 1947. He remembered finding a balloon crash site about 60 miles north of Roswell just off the main highway, with both the military and rancher Mack Brazel there, or about 30 miles NE of the Foster Ranch site. Was this the real final crash site of Flight #4, and did the military take Brazel there to coach him in what to say later that evening during a press conference? Two sample trajectories are than Moore used. This still isn't a highly probable crash site, but still much more probable than Moore's.
Just how predictable would the balloon trajectories have been anyway? Original Mogul project summaries said not very. Moore also coauthored a 1948 journal article which said the same thing and gave an interesting example of the relative uselessness of wind data from surrounding weather stations in predicting one early Mogul flight from July 7, 1947. Variability of wind data from this flight is analyzed to justify some of the assumptions in plotting the two Kellahin site trajectories and also plotting another possible trajectory to the Foster Ranch site. Nonetheless, any Foster Ranch trajectory remains less probable than trajectories taking the balloons further to the east and north,
In the past, Moore has been a strong advocate that Roswell base knew nothing of Project Mogul at the time of the Roswell incident. (However, by his own admission in his Air Force interview in 1994, in 1947 he was just a young civilian graduate student and he and the other civilians didn't interact much with the military people. Moore's lowly, non-military position would unlikely make him privy to what Roswell base might or might not have known).
Given the rest of Moore's manipulations to try to advance his Mogul crash position, Sparks reasoned Moore deliberately altered the graphic to help support his claim that Roswell base knew nothing of Mogul by making Flight #5 appear to miss and crash further from the base than it really did. This would explain why he removed Roswell base from the graphic, replaced it with Roswell town to the north, further moved Roswell town to the west and the crash site to the east, all to increase the apparent separations.
Although mind-reading like this is always hazardous, Sparks supported his position by sending me statements Moore had recently made after Sparks had gotten engaged in an e-mail debate with debunker Karl Pflock over Moore's manipulations of data. Pflock, a big Moore booster and Mogul advocate since 1994, served as an intermediary between Sparks and Moore.
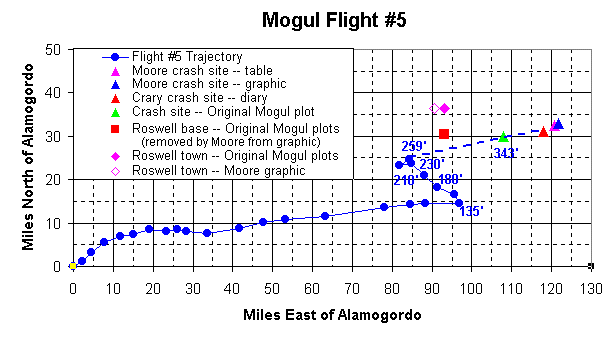
Sparks raised the issue of the graphic alteration and that Flight #5 had actually come quite close to the base. To this Moore replied that Flight #5 never came closer than 15 or 20 miles to the base and would have been too small to be noticed. This is patently false, as proven by the actual Mogul trajectory plot which incontrovertibly shows it passing within 4 or 5 miles of the base during its descent.
Furthermore, an examination of the trajectory plot above indicates Flight #5 lingered for over an hour within about 10-12 miles of the base during its slow backward stratospheric drift phase. (Note the minute markers by the data points.) There was a lot of time for the base to have caught sight of it.
Moore in his response also tried to raise a red herring about how maybe Roswell base couldn't see the balloons on account of clouds. If that was the case, then how did they get the trajectory plot to begin with? In fact, the Mogul summary sheet states that Flight #5 was tracked visually through a theodolite (surveyor's telescope) for 90% of its flight. Thus, they were able to see Flight #5 from Alamogordo at a distance of nearly 100 miles. Under the circumstances, why would Moore think clouds would obscure the balloons from the view of Roswell base, only a few miles away?
Given such additional doubletalk from Moore, one can't help but be suspicious about Moore's intentions in altering the graphic of Flight #5, that maybe he did try to remove Flight #5 as far from the base as he possibly could. Although the actual crash site of Flight #5 is ambiguous from the recorded data and subject to interpretation, using a crash site that is different from any of the recorded ones smacks of intentional data manipulation. So does eliminating an important landmark from the graphic (Roswell AAF) and also moving another (Roswell) to a slightly different location than it should be. All of these maneuvers happen to increase the apparent distance between Flight #5 and observers at Roswell AAF. Coincidence? We think not!
It should also be noted that Moore used the identical, altered Flight #5 plot in both his 1995 & 1997 models, with Roswell AAF erased from the plot and Roswell town and the crash site both moved to bogus locations. (1995 plot reproduced in Appendix G of Karl Pflock's 2001 book.) Thus the alteration cannot be rationalized as some publisher printing error in his 1997 book. (Click here to view figures).
Moore also wrote deceptively in the 1995 figure legend, "The plot for Flight #5 was taken without change from Figure 32 in NYU Balloon Project Technical Report #1." This is simply a flagrant lie, since the original figure is very definitely altered. Where the balloon ended up is part of the trajectory.
Sparks is also highly critical of Moore failing to acknowledge that Roswell researcher Kevin Randle had provided him with the initial weather data that launched Moore's original "research" into Flight #4's trajectory. In 1995 in writing about his first model, Moore fully acknowledged Randle's contribution. But in his 1997 book, Randle was completely written out of the picture. Instead Moore's co-author, Ziegler, slimed Randle and other authors of Roswell books as opportunists promoting the Roswell "myth" strictly for personal profit. (p.62) [No doubt Ziegler donated his book advance and royalties to charity rather than personally profit from the Roswell "myth."]
What Does Moore Remember?
One of the cornerstones of Moore's argument is the memory he says he has of them tracking his hypothetical "Flight #4" in the bright early morning sun as it passed near Capitan Peak and the small towns of Arabela and Bluewater, N.M. Moore uses this memory as a fixed "constraint" on the trajectory. Flight #4 had to pass near these locations. As Moore writes (pp. 84-85):
"I have a distinct memory that James Richard Smith, better known as J.R.,
watched the 4 June balloon train through a theodolite on a clear, sunny
morning, and that Captain Larry Dyvad, our contact with the Watson Lab
SCR-584, reported that the radar had lost the targets while J.R. had them
in view. It is also my recollection that the balloon train was tracked to
about 75 miles (120 km) northeast of Alamogordo by the B-17 crew. As
I remember this flight, the B-17 crew terminated their chase while the balloons
were still airborne (and while J.R. was still watching them through the
theodolite) in the vicinity of Capitan Peak, Arabela, and Bluewater, New
Mexico. I, as an easterner, had never heard of those exotically named places,
but their names have forever afterward been stuck in my memory. This
provided the only connection that I have ever had with those places."
[emphasis added]
Please note the last sentence. Moore is stating that he never would have heard of these place names except for this one flight.
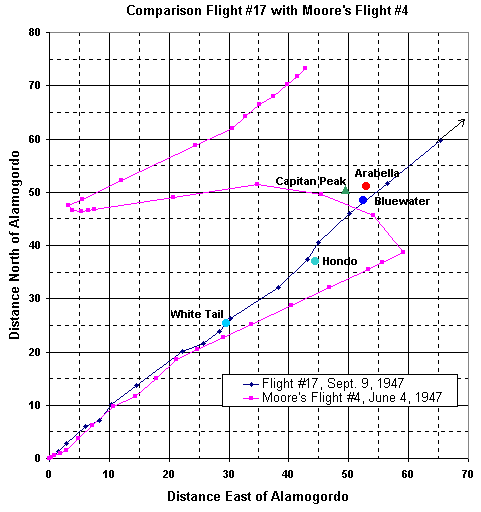
But is this really true? Moore's memories for the details of Flight #4, on which he stakes so much, seem remarkably poor for a Mogul flight only 3 months later on Sept. 9, 1947. See the plot of Flight #17 compared to Moore's hypothetical trajectory immediately below.
Note that Flight #17 passed almost directly overhead Arabela and Bluewater, those "exotically named places" which Moore claims he only would have heard associated with Flight #4. Obviously this is just more Moore mumbo jumbo. Likewise #17 passed within only 3 miles of Capitan Peak, another landmark Moore associated exclusively with Flight #4.
The trajectory plot for Flight #17 is Figure 56 in a Mogul summary technical report dated April 1, 1948. Also in this summary are Figures 32 & 33, which provide the ground trajectory and altitude plots for Flight #5, and Figures 34 & 35, which provide the same for Flight #6. Moore made extensive use of these plots in his book to recreate his revised versions of Flights #5 & #6. So why doesn't he know of Flight #17 in the same project summary?
Moore also co-authored a paper in the Journal of Meteorology in 1948, submitted in December, 1947, in which this same trajectory plot for Flight #17 is included in the paper.
Various other "exotic" New Mexico locales are marked on this plot such as White Tail, Hondo, and Escondido. I have noted the positions of White Tail and Hondo on the above plot (Escondido no longer seems to exist). The only thing that can be said in Moore's defense is that for some reason Arabela and Bluewater are not marked on the original Mogul plot, even though Flight #17 went right by them, just as it did White Tail and Hondo.
Obviously it is not true that Moore would only have heard of Arabela and Bluewater for Flight #4. Perhaps he simply got Flight #17 and Flight #4 confused.
Of course, this is nothing but speculation. However Moore is also a booster of the ridiculous Air Force theory that reports of alien bodies represent witness confusion with "crash dummies" tested in New Mexico from the next decade. Believing Moore got a flight from only 3 months later confused with Flight #4 is much less of a stretch than the A.F. time-compression, crash dummy theory.
An Alternate Flight #4 Theory -- Possible Relation to the Roswell Incident
One big problem that Charles Moore faced in trying to get his Mogul Flight #4 up to the Foster Ranch were the winds recorded at the Orogrande weather station. They were too strong and too northeasterly in direction. Any realistic model results in the balloons badly overshooting the Foster Ranch, which was to the NNE of Alamogordo.
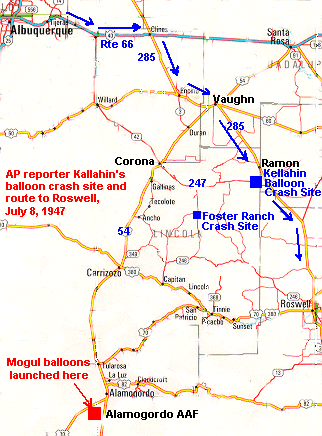
Instead of forcefitting a trajectory to the NNE, maybe it's time to consider the far more likely fate of Flight #4 ending up well to the east of the Foster Ranch, and also well north of Roswell. There is one Roswell incident story that may relate to the ultimate resting place of Flight #4. This was told by Associated Press reporter Jason Kellahin.
Kellahin was dispatched to Roswell from the AP Albuquerque office about 45 minutes after the story broke on the AP wire (Kellahin, in fact, was the one who took down the base press release when it was phoned in from Roswell by the AP "stringer" George Walsh.).
There are a number of problems with some of Kellahin's testimony, as noted in another section. He claimed to have driven out to the Foster Ranch first before heading into Roswell and interviewing rancher Mack Brazel there in the company of military. In addition, he claimed to have seen the remains of a balloon crash of some sort at Brazel's place.
But Kellahin also claimed that Brazel's ranch was south of Vaughn, and that the balloon crash site was right off of Highway 85 leading into Roswell from the north, just off the Corona road. However, this is the completely wrong location for the Foster Ranch, which is about 30 miles further to WSW of Kellahin's described balloon crash site. This is all indicated on the following map.
Since Kellahin would have tried to get to Roswell as quickly as possible to cover the story, he likely would have followed the most direct route from Albuquerque to Roswell. Thus he would have first headed east down the fabled Route 66 (now Interstate 40), turned south on Highway 285 to Vaughn, then followed 285 south to Roswell. Just south of Ramon would have been the Corona road to the west (present-day Highway 247). According to Kellahin's story, the balloon crash site he claimed to have seen would have been close to the location marked on the map.
Also marked on the map is the Foster Ranch debris field crash site, where Kellahin claimed to have driven and talked to rancher Mack Brazel and the military in the field. It is well-removed from the direct route to Roswell. Also marked is Alamogordo AAF, where the Mogul balloons were sent up.
The most serious problem with Kellahin's basic story is the timing. We know the Roswell base press release went out at about 2:30 p.m. MST, and that AP went after the story about 45 minutes later (see AP chronology). Thus Kellahin probably would have left Albuquerque between 3:15 and 3:30 p.m.
The 200 mile drive to Roswell probably would have taken about 3-1/2 hours by the most direct route. He would have arrived in Roswell shortly before 7:00 p.m., which agrees with his memory of interviewing Brazel that evening.
However, had he detoured down the Corona road and driven all the way out to the isolated Foster Ranch over very bad or non-existent roads, he would have added at least another 4 or 5 hours to his trip. The interview would have occurred around midnight.
Suppose, however, that he did encounter Mack Brazel at a balloon crash site near where he remembers near Highway 85, but not at the Foster Ranch. He perhaps would have been delayed by an hour on this short detour from the main highway, and thus arrived in Roswell shortly before 8:00 p.m. This would remain consistent with the established chronology of times based on historical data.
If that was the case, what balloon crash was it and why was Brazel there with the military? The scenario advanced here is that it could have been the true remains of Moore's Flight #4, discovered by the military on July 8 during recovery operations while they were searching the region west of Highway 285 looking for more of the crash. (See section on the military cordon thrown up along Highway 285 north of Roswell.) The reason Brazel was there with the military was to coach him in what to say he found on his ranch when he was interviewed later on.
That could explain why Brazel's description did end up sounding like the remains of a Mogul neoprene balloon crash, before Brazel recanted his story at the end and insisted it wasn't a balloon crash. (See Roswell Daily Record story of Brazel's press conference.) Initially, however, Brazel described debris comprised mainly of paper, foil, sticks and strips of rubber. Brazel also described the rubber debris as being scattered across an area 200 yards in diameter, which would be consistent with the 600-foot tall Mogul array.
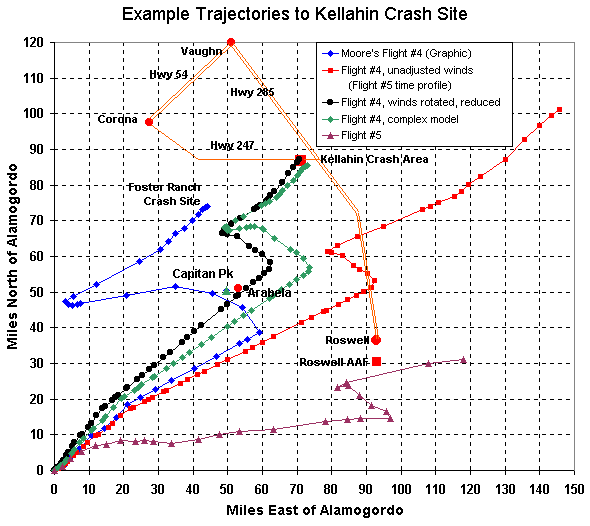
Mogul records show that the attempted flight on June 4 (the alleged Flight #4) was actually :"canceled" because of cloudy weather, though the balloon cluster was later sent up (once the rubber balloons were filled, they couldn't be reused, unlike the rest of the equipment, and were released even if a flight was canceled). But for the sake of argument, let us assume that a true full-configured balloon flight went up (but was never recorded), and see if it was possible to have drifted to the location recalled by Kellahin. Since this site could not be the Foster Ranch because of the timing, a possibility is that Brazel and Kellahin where at the crash site of "Flight #4", about 25-30 miles ENE of the Foster Ranch debris field.
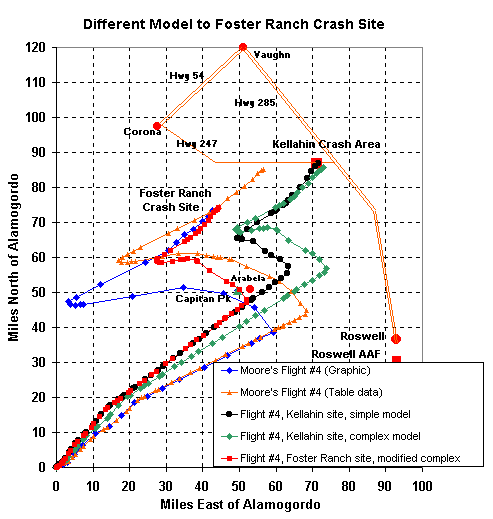
The following graphic considers two models among many of how this alleged "Flight #4" could have ended up at Kellahin's described position. These two Flight #4 trajectories (blackand green) are closely modeled after the successful Flight #5 the next day (brown).
The black trajectory is the simpler of the two, retaining the same time profile as Flight #5, the same total flight time and the same rise and fall times through the troposphere, not Moore's speeded up ones. It also assumes a post-dawn launch time like Flight #5, not Moore's late night launch, and the same time aloft before the balloons started to drop. Thus the time aloft in the stratosphere (the westward "jog" in the trajectory) is also identical to Flight #5's. The stratospheric wind speeds and directions are also closely adhered to (instead of using Moore's modifications, such as speeding up the winds).
However, if we adhere strictly to the Orogrande wind data set, we encounter the same problem that Moore did, namely the balloons badly overshoot the "desired" crash area. This is indicated by the red trajectory. The balloons have a very long ascent and descent phase. Also the winds are blowing too strongly to the east, which rotates the main trajectory away from the Kellahin crash area. (Note that by sticking strictly to a Flight #5 time profile, the crash site is over 100 miles removed from Moore's!)
One possible "solution" to the problem of the overly-long descent track is to examine the track of Flight #5 the next day. Flight #5 had a descent time only 2/3rds of its ascent time, so one would expect a shorter descent path than during ascent. But Flight #5's descent trajectory is only about half of what would be expected based on time alone. This would seem to indicate that average wind speed had dropped to only about half of what it was on ascent.
When we examine wind data of Flight #11 in the next section, it turns out that it too had a falloff of about 40% in wind velocities at about the same time into its flight at the same time of day. So one assumption that is clearly questionable is that the wind speeds at distances well removed from Alamogordo and also later in time are predictable from winds earlier in the flights and closer to Alamogordo. This clearly didn't seem to be the case for Flights #5 or #11. Maybe the same would be true for Flight #4 the day before. (I find it strange that Moore didn't take this same line of argument to shorten his descent path, since it has some support in the #5 & #11 data. Instead he resorted to using a greatly shortened descent time, which has no support in the existing Mogul data set.)
If this is true for winds speeds, maybe the same is true for wind directions the further away one got from Alamogordo. This is again supported by the Flight #11 wind data (next section), in which wind direction at a fixed altitude varied by over 50 degrees over a 6-1/2 hour period and 60 miles of flight. Project Mogul summaries made special note of Flight #11, stating that wind directions (and hence balloon trajectories) did not seem to be particularly predictable based on data from surrounding weather stations at El Paso, Roswell, and Albuquerque.
Thus the following manipulations were done on the Orogrande wind data set to deliberately guide Flight #4 to the Kellahin crash site. Winds during ascent were cut to 80% of the values of Orogrande and to half of this, or 40%, during descent. Furthermore, wind directions were rotated 12 degrees counterclockwise during both ascent and descent to steer the balloons further to the north.
This produces the black trajectory in the diagram that leads directly to Kellahin's crash area. Like Moore, I could brag that I "calculated" a trajectory that led "exactly" to a particular crash site. It is indeed "calculated" -- calculated to make it do exactly what I want, just like Moore's "calculated" trajectory.
However, such a model does have the advantage of being much simpler than Moore's, using far fewer assumptions, and also sticks closer to most of the known Mogul flight data set. However, the assumptions about wind speeds and direction are perhaps no less questionable than Moore's various assumptions and may seem just as forced and arbitrary (just how unlikely is dealt with in the next section).
Here's a more complex model that also takes the balloons very close to Kellahin's site, but with less extreme assumptions about the winds (green track). It makes other assumptions, similar to Moore's, but much less extreme, and stays well within the known Mogul data set.
Wind direction is rotated only 7 degrees more north on both ascent and descent, instead of the previous 12 degrees. As Moore himself noted, the Orogrande data had inherent uncertainty in direction because of the way it was recorded amounting to +/-3 degrees of standard deviation from the recorded values. This uncertainly alone could account for nearly half of the 7 degree change in direction used in this model. And as the Flight #11 data indicated, there is an inherent variability in the wind directions anyway over time and space that isn't caused by measurement error, but by Nature. For Flight #11 there was 17 degrees of standard deviation from the average at one given altitude over a prolonged period. Using a calculation like Moore's and Flight #11 data as a model, a standard deviation of about 7 degrees in wind direction might be expected through multiple layers of atmosphere based on inherent wind direction variability.
To compensate for the decreased wind rotation from the previous model, balloon time aloft before descent has been increased by 30 minutes to push the balloons further to the west in the stratosphere About 20 minutes of this could be assigned to "normal" variation, since Flight #7 stayed aloft about 20 minutes longer than Flight #5 before it began to drop. Another 10 minutes could be added by simply pushing the launch time forward by a mere 10 minutes over that of Flight #5, but still around dawn. Gone is Moore's very strained assumptions of pushing the launch time clear back to 3:00 AM. and adding 2-1/2 more hours to this portion of the flight.
Wind speeds on ascent remain 100% of the Orogrande data set, but are cut to 50% on descent, as seems to be the case for what happened with Flight #5 and similar to Flight #11. To compensate for the increase in wind speeds over the previous model, flight ascent time has been cut by 10 minutes, somewhat similar to what Moore did in his table, but not in his graph. Unlike Moore, my model exactly follows the Flight #5 altitude/time profile up to 35,000 feet, at which point the ascent on Flight #5 was slowed by cutting loose some lifter balloons. In my model the balloons rise faster at the end of ascent than Flight #5, shaving off 10 minutes of ascent time. This makes the balloons ascend to their first turn point in the same time as Flight #7 is extrapolated as taking (125 minutes) had they actually risen into the stratosphere (see altitude/time profiles in main section.).
The balloons are also made to drop 10 minutes faster than Flight #5 to further shorten the length of the descent path. This decreases the drop time from 96 minutes to 86 minutes. This is still longer than Flight #7's time of 72 minutes, and more than half an hour greater than Moore's bogus 54 minutes
Because this Flight #4 model uses far less extreme assumptions than Moore's, I would deem the ultimate crash region to be much more probable than Moore's, by one to two orders of magnitude. However, the problem with any model is the numerous uncertainties in the many variables and lack of any actual Flight #4 trajectory data that would help narrow down the possibilities. The more one plays with these trajectories, the more obvious it becomes just how easily one can steer the balloons just about anywhere one wants by "tweeking" the various variables a little bit one way or another. About all one can argue is the reasonableness of one's assumptions and hence the reasonableness of the resulting calculated crash site.
Predictability of Mogul Trajectories
In the previous section, one of my primary assumptions in getting Flight #4 to the Kellahin crash site was to assume the wind direction data collected from the Orogrande weather station and used by Moore in his model did not necessarily reflect the precise wind directions or speeds many miles removed from Orogrande. E.g., Orogrande is nearly 100 miles from Arabela, one of the pivotal points in Moore's model, nearly 120 miles from the Foster Ranch crash site, and 140 miles from the Kellahin crash site.
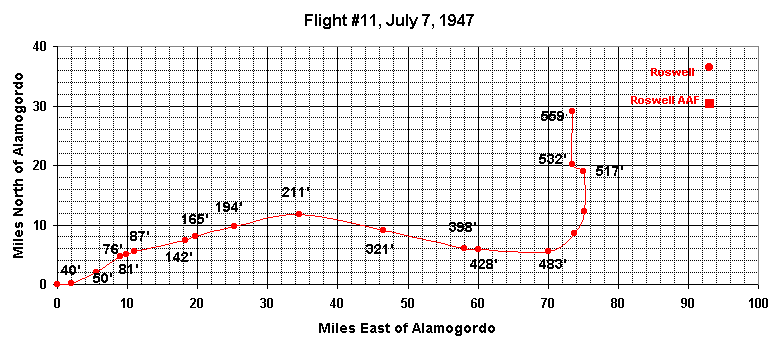
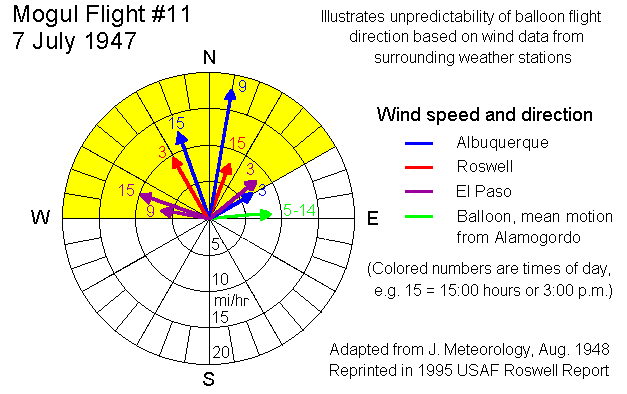
Such an assumption is borne out to some extent by Project Mogul data and summary statements. One balloon flight in particular was noted by the Mogul Project as being almost totally unpredictable in direction based on surrounding weather data, namely Flight #11 on July 7, 1947, that ended up crashing about 19 miles west of Roswell base. Below is the plotted trajectory of Flight #11:
In December 1947, Moore coauthored a paper with two other Mogul scientists, published in the Journal of Meteorology, August 1948, in which they wrote about Flight #11:
"The most striking feature of the constant-level balloon flight originating at Alamogordo Army
Air Base at 05 h 08 m MST on 7 July 1947 is the disagreement between the actual trajectory
and the trajectory that might have been estimated from routine upper-wind reports. In this
connection the observations from the Weather Bureau stations at El Paso, Roswell, and
Albuquereque have been examined, since the path of the balloon was within the triangle formed
by these stations."
They then included the following figure to illustrate the point:
One can see from this plot that Flight #11 had a trajectory that took it almost due east on average (green arrow) over a 9 hour period. Yet wind directions from Albuquerque, Roswell, and El Paso varied widely, not only between stations but even at the same station over time. All winds at these stations were in the region highlighted by yellow and outside of Flight #11's average path, sometimes wildly incompatible with it. Look, e.g., at El Paso, the closest of the weather stations, only about 80 miles from Alamogordo AAF. At 9:00 AM it had winds blowing in the exact opposite direction from where Flight #11 was actually going. Roswell, about 95 miles to the ENE, had winds blowing to the north. This is reflected in the Flight #11 path only towards the end of the flight when it came within 30 miles of Roswell and finally swung to the north.
A later Mogul project summary from July, 1949, made the same comment as the J. Meteorology article about the uselessness of the weather data from Albuquerque, El Paso, and Roswell. However, it did indicate that weather data from White Sands (possibly the Orogrande weather station) did have some predictive value regarding Flight #11:
"Another striking feature of the flight is the disagreement between the actual flight path and the
trajectory that might have been estimated from routine upper-wind reports. Reports from
El Paso, Roswell, Albuquereque, and White Sands were used for comparison with the observed
trajectory. Except for White Sands, none of these stations reported any wind from the WSW
at or near the floating level during the 12-hour period covered by the flight. At White Sands
a very shallow current was detected moving in the direction indicated by the balloon flight.
This clearly demonstrates the non-representiveness of the ordinary pilot balloon observation."
While the White Sand's WSW winds would be compatible with the trajectory of Flight #11 during the first portion of its flight, an examination of the trajectory plot above indicates that at 211 minutes into the flight, the balloon suddenly changed direction and started moving to the ESE, indicating winds from the WNW rather than WSW. Thus even the White Sands data seems to have had limited predictability.
Variation in the winds becomes even clearer when speeds and directions are calculated from the Flight #11 trajectory, as is summarized in the following table, giving these values from 40 minutes into flight until 428 minutes. Calculations were limited to this time period because the balloon was floating at a constant level of 16,000 feet with movement up or down by no more than 1000 feet. Thus variations in speed and direction were caused primarily by inherent variability, not changes of altitude.
(Note: Azimuth represents degrees from north in a clockwise direction. Winds, e.g., blowing from an azimuth of 270 degrees would be from due west and would push the balloons to the east.)
Flight #11 statistics (July 7, 1947)
Flight timeSpeed (mph)Azimuth (degrees)
(minutes)Average Std. Dev. Range Average Std. Dev. Range
First of all, note the wide variation in average speed from 40'-211' compared to 211'-428'. Winds during the latter 3-1/2 hour period dropped to only 60% of what they had been during the previous 3 hours.
(7.2 mph vs. 12.2 mph). (This is very similar to how the winds dropped 3-1/2 hours into Flight #5, decreasing to about half of what they had been when the balloons were rising.) Also note the very wide range of speeds from 4 mph to 34 mph for Flight #11. Winds would drop to a barely perceptible breeze, but could also gust. The standard deviation in wind speed (a measure of the variability) was nearly 10 mph in the first portion of flight.
Now observe the wind direction or azimuth. During these same two periods, average wind direction shifted by over 30 degrees (from 247 to 281 degrees). The total range in wind directions was over 50 degrees (from 232 to 284 degrees) Finally, the standard deviation in the flight path during the first leg of the flight was around 8 degrees and 17 degrees overall. What this means is that around two-thirds of the time, one would expect winds to be within 17 degrees of average, but a third of the time one would also expect them to be greater than 17 degrees from the average.
These wide swings in direction and speed all occurred within 60 miles of Alamogordo and 90 miles of the Orogrande weather station. One would also expect similar unpredictability of speed and direction for Flight #4 wind data over time and distance.
Moore made a calculation in his book (p. 103) about the overall effect of Orogrande measurement uncertainty on the trajectory. Directional measurements were in compass points and had a "granularity" of 22.5 degrees in azimuth. Thus actual wind direction at each measured altitude was actually within +/-11.25 degrees of true direction. Since Moore used 17 levels of altitudes in constructing his tropospheric trajectory, the expected standard deviation of overall trajectory through all 17 levels was 11.25 degrees divided by the square root of 17 minus one, or 11.25/4 = 2.84 degrees.
Moore was making the point that the wind direction measurement uncertainty would not have a huge effect on overall trajectory. However, Moore didn't factor in inherent variability of wind direction over time at any given altitude. Using Flight #11 as an example, the wind at a given altitude shifted direction over a range of 52 degrees during a 6-1/2 hour period. Half of this would be 26 degrees, more than double the uncertainty caused by measurement technique. The standard deviation through a 17 layer model could thus be more in the range of 26/4 = 6.5 degrees rather than Moore's 2.8 degrees.
In the previous section of model flight paths to the Kellahin crash site, the more complex model made the assumption that the overall trajectory could have been rotated by 7 degrees from the Orogrande data set. This is similar to the 6.5 degrees of standard deviation calculated above for inherent variability for Flight #11. Admittedly, this is a very limited data set, yet it is a good indication that trajectories could easily have been rotated by considerably more than in Moore's calculation.
The amount of trajectory rotation in the more complex model thus seems fairly reasonable -- perhaps about one standard deviation away from the Orogrande data set. However, the 12 degrees of rotation for the simpler model would fall almost 2 standard deviations away and be much less likely.
Estimating the standard deviation in wind speeds is much more difficult given the limited data and wide fluctuations in absolute speeds for Flight #11. As a crude estimate, along the first leg of Flight #11, average wind speed was 11.2 mph with a standard deviation of 9.5 mph, about 85% of the average. Through 17 layers, the standard deviation might therefore be on the order of 85%/4 = 21%.
On the second leg of Flight #11, average speed was 7.2 mph with a standard deviation of 2.6 mph, or 36% of the average. In a 17 layer model, therefore, this second leg would predict an overall standard deviation overall on the order of 36%/4 = 9%. Averaging the two (21% & 9%), standard deviation overall might be on the order of 15%.
The complex Kellahin model assumed no drop in wind speeds during ascent, whereas the simpler model assumed a 20% drop. Again, this may be beyond one standard deviation and is pushing the boundaries of reasonableness.
Both the simple and complex Kellahin models assume a 50% drop in wind speed during descent compared to ascent. This has some experimental support from Flight #5 in which the descent wind speeds did seem to be only about one half of those on ascent. Similarly Flight #11 showed a 40% drop in wind speed during its second leg of flight. This assumption, therefore, does not seem unreasonable, but it is impossible from the limited data to determine if the same would have been true for Flight #4.
Could Moore have created a trajectory to the Foster Ranch crash site that also used similar assumptions about wind speed and direction variation? It is certainly possible to create models different from Moore's that bring the balloons to the Foster ranch crash site, but overall they still require more extreme assumptions than needed to get the balloons to the Kellahin site. Therefore, such trajectories would have to be deemed less probable.
E.g., if we modify the more complex Kellahin site trajectory by rotating winds 12 degrees instead of 7 degrees and cut the used wind velocities by 24% on ascent and descent, the balloon path is to the Foster Ranch crash site instead of the Kellahin crash site. This is illustrated below, with the usual Moore Flight #4 bogus graphic trajectory (blue) "exactly" to the Foster Ranch, his table trajectory (orange), the two Kellahin trajectories (the simpler model, black, and more complex one, green), and then the modified Kellahin complex model (red) with the winds reduced and more strongly rotated.
This model is somewhat of a mix of the Kellahin simple and complex models. It has the same wind rotation (12 degrees) and similar wind reduction (76% on ascent vs. 80%, 38% on descent vs. 40%) as the simple model. But it also has the added assumptions of the more complex model of somewhat faster rise and fall times and longer time aloft.
Because it uses much less probable values for wind direction and speed than the Kellahin complex model, this modified complex model to the Foster Ranch is at least an order of magnitude less probable than the complex trajectory to the Kellahin site. Moore's trajectory, with its many strained assumptions, has a similar lower order of probability. The Foster Ranch crash site still remains a statistical outlier no matter what combination of assumptions are used to get the balloons there. Fewer, less extreme assumptions always take the balloons further to the north and east of the Foster Ranch, such as the Kellahin crash site.
This is true even for Moore's table model, not his hoaxed graphic trajectory, where he improperly calculated it, cut his northeast ascent path short, and forced an early turn west. If he had stuck to his table data, the crash site ended up about halfway between the Foster Ranch and Kellahin crash sites, i.e., to the north and east of the Foster Ranch crash site. (orange trajectory)
Addendums
More Moore Mischief
Moore has also been guilty of altering some of the original Mogul data plots. The following example was recently pointed out to me by researcher Brad Sparks regarding Moore's treatment of Flight #5.
One often-argued point regarding Project Mogul is whether Roswell base would have known anything about it before the fateful "Roswell incident" broke on July 8, 1947. Around 1996, after studying reprinted Mogul trajectories in the Air Force's debunking Roswell report, I noticed that Flight #5 passed very close to Roswell base the day after Flight #4 and pointed this out in discussion groups on the Net.
The original Mogul ground trajectory plot has "Roswell" labeled on the diagram, with the trajectory showing Flight #5 passing only about 4 or 5 miles south. The trajectory plot in the same Mogul summary report for Flight #11 (which also passed near Roswell) has both "Roswell" and "Roswell AAF" labeled on the same plot. Thus I initially assumed "Roswell" on the Flight #5 trajectory plot meant Roswell town instead of Roswell base. (Click here to see the two original plots.) In that case, 4 or 5 miles south of Roswell town would have placed Flight #5 almost directly over Roswell base while it was descending. The base with its control tower operators, plane spotters, weather observers, pilots in the air, etc., could hardly have missed seeing it. Furthermore, it was being followed by a B-17 chase plane which would have had to identify itself and state its business.
However, it turns out "Roswell" on the Flight #5 trajectory meant Roswell base. So Flight #5, though not passing directly over the base, still passed 4 or 5 miles south of the base, a near miss. It still should have been easily observed by various base personnel.
However, Moore when he redrew Flight #5's ground trajectory in his 1995 model and again in his 1997 book, failed to note the location of Roswell base on his graph. "Roswell" on his plot, instead of meaning the base on the original plot, became Roswell town, 6 miles further north. By moving the location of "Roswell" and not noting the location of the base, it became less obvious just how close Flight #5 actually came to the base.
Furthermore, the original trajectory plot of the crash site placed it about 15-16 miles due east of the base. Albert Crary's diary placed it "some 25 miles east of Roswell." (It is possible this discrepancy between plot and diary site is explained by Crary meaning driving miles outside of Roswell town for the recovery team, which would be correct, instead of direct air miles from the base.) However, Moore's table data in his book placed it about 28 miles east of the base, and his diagram (Figure 2, p. 88) placed it about 29 miles east.
In addition to this, Moore's diagram also moved the town of Roswell about 2 miles further west than where it is indicated on the original Mogul plots. Thus in his 1995 & 1997 diagrams, the distance to the crash site has been increased to 31 miles, double that of the original Mogul plot. This is all summarized immediately below.