Former Mogul scientist and Roswell debunker Charles Moore set out to demonstrate that his little lost Flight #4 Mogul got blown by the winds to the Foster Ranch and thus explained the Roswell crash. Although Moore titles his section "A Possible Ground Track for NYU Flight #4", he never really considers any other possible tracks, such as those he would have obtained by adhering to his stated assumptions and real Mogul data. Instead Moore used improbable secret assumptions and improperly calculated the data in order to make his "possible" trajectory work. His "possible" track is really an improbable one, in fact completely bogus.
A far more viable mathematical model would assign mean values to the variables, such as rise time, time aloft, and fall time, utilizing data from the three known neoprene balloons of this period (Flights #5 - #7) and perhaps analyze the effects of variable variance on the trajectory and crash site. In other words, one should stick to the known data set and not invent new data, such as Moore's abnormally fast drop time and abnormally long time aloft. In this way, zones of probability could be generated where the balloons could have come down.
E.g., I have attempted to do this in a small way by using the actual rise and fall data of the successful Flight #5, what Moore said he was using but didn't. These also happen to be midrange values for the three known neoprene Mogul flights, i.e., they are well within the known data set. When these numbers are plugged in and the resulting table correctly caculated, the balloons end up missing the ranch by some 70 miles. If in addition we assume a post-dawn launch and much shorter flight time like Flight #5, the miss is more like 100 miles.
Overall, any reasonable (and correctly calculated) model greatly weakens the Mogul Flight #4 hypothesis for the Roswell crash, since the historical wind data used by Moore shows that winds were blowing much too hard and it would have been highly unlikely for #4 to end up at the Foster Ranch crash site. However, it doesn't necessarily kill the theory entirely. The joker in the deck is the actual wind values for regions far removed from the Orogrande winds that he used in his model. Had they been greatly reduced and more rotated towards the north, e.g., then a Foster Ranch crash site would become much more probable. (See addendums for a sample trajectory to the ranch site using rotated and reduced winds.) However, this is nothing but conjecture at this point not supported by any actual data.
This is also a cautionary tale in how good science can go bad because of extreme bias. The basic idea of developing a model to predict trajectories was a good one. But I suspect Moore discovered early on that his model would not do what he had hoped, namely get his Flight #4 to the ranch in a plausible way. At that point he started resorting to trickery -- failing to openly state his assumptions and why he made them. He couldn't do that, because some of his assumptions were so outrageously bad, there was no justifying them.
But even worse than this, he improperly calculated his own data and hoaxed his own model. In the end, he simply force-fit the trajectory he wanted. Moore's Sci Fi Channel statement in 1997 that his trajectory was "calculated" ironically turns out to be very true, but not in the sense that Moore originally intended.
Introduction
Charles Moore, one of the original Project Mogul balloon engineers, started out as a fairly objective party when it came to the Roswell incident, dating back to original interviews around 1980 (perhaps because like many other Mogul balloon people, he had had his own UFO sightings). But sometime in the 1990s, he cast his lot with the debunkers. Moore seems to have become firmly convinced that the Project Mogul Flight #4 balloon train, missing from Mogul records and totally undocumented as ever even existing, allegedly launched June 4, 1947 from Alamogordo Army Air Field, must have been what rancher Mack Brazel found crashed on his ranch about 85 miles NNE of the launch site and reported as a crashed flying disk. Thus "Flight #4", in Moore's mind, is definitely the solution to the Roswell mystery.
In 1995, prompted by weather records supplied to him by Roswell researcher Kevin Randle, Moore attempted to recreate a possible trajectory for the undocumented, hypothetical Flight #4. N.M. skeptic Dave Thomas in the July 1995 Skeptical Inquirerstated triumphantly:
Moore's analysis indicates that after Flight 4 lifted off from Alamogordo, it
probably ascended while traveling northeast (toward Arabela), then turned toward
the northwest during its passage through the stratosphere, and then descended
back to earth in a generally northeast direction. Moore's calculated balloon path is
quite consistent with a landing at the Foster ranch, approximately 85 miles
northeast of the Alamogordo launch site and 60 miles northwest of Roswell.
Another skeptic in a review of Moore's book, UFO Crash at Roswell, The Genesis of a Modern Myth, cowritten with Benson Saler and Charles Ziegler wrote:
Moore meticulously calculatesthe probable path of this balloon, based on the known
weather of the time and the flights of later, better tracked balloons. This path ends ---
surprise! --- at the Foster ranch, 75 miles from Roswell, where the debris which started
the whole thing was recovered.
So according to this skeptic's spin, Moore's path to the Foster ranch was both "the probable" one and "meticulously calculated" by Moore.
Similarly, Roswell debunker and Moore promoter Karl Pflock put the following propagandistic spin on the story in his 2001 book Roswell: Inconvenient Facts and the Will to Believe (Appendix G):
"Utilizing U.S. Weather Bureau winds-aloft records and data from ...Mogul service Flights
5 and 6, Professor C. B. Moore reconstructed the likely course followed by Flight 4 on its
way into history as the Roswell 'crashed saucer.' ...While Professor Moore is careful to
explain that the reconstructed Flight 4 route is only a possible track, he and a number of
colleagues who have examined the data and Moore's calculations have no doubt that the
weather conditions do not preclude Flight 4 as the 'culprit' and in fact positively allow for it."
Again we find the use of spin words and phrases such as "likely", "no doubt", "positively allow for it", as if Moore had presented a compelling if not overwhelming case. Futhermore, note the statement about how a number of unnamed "colleagues" supposedly having "examined" the data and calculations, making it also seem as if Moore's model had gone through a careful peer-review scientific process in which esteemed fellow scientists had put their official stamp of approval on it. And remember, all this gushing is over a alleged balloon flight for which there is no record of existence in official records.
Despite the skeptical spin in support of Moore's model, what's the truth of the matter? Would winds aloft on June 4, 1947 "likely"have taken a balloon to where Moore placed it, even if existed?
Ironically, Moore himself deemed his first1995 model inadequate, because in 1997 he had replaced it with a modified one, as detailed in his aforementioned book published by the prestigous Smithsonian Press. Since this is Moore's most recent model, we shall concentrate on it in this essay. (Click here for plots of Moore's two very different trajectories.)
Moore made the following statements about his model in a 1997 Sci Fi Channel special on Roswell:
"The winds on the morning of June 4th were exactly right [emphasis mine] to carry the
balloon from Alamogordo to the Arabela area. If the balloon behaved as the balloons did
on the next two flights we made, i.e. going into the stratosphere and catching the easterly
winds in the stratosphere, it is possible -- I have calculated a trajectory that would have
exactly landed the balloon on the Foster Ranch."
Definitive statements like this by Moore made it sound as if he had scientifically proven that the hypothetical Flight #4 flew to the Foster Ranch. Note how he speaks of the winds being "exactly right" and how he "calculated" a trajectory that made the balloons land "exactly" at the crash site As far as most uncritical skeptics were concerned, Moore's "calculated" Flight #4 trajectory to the Brazel debris field was just about the final word on Roswell.
Both researcher Brad Sparks and myself have recently taken a true skeptical look at Moore's work. After close examination of his data and methods, it turns out Moore can only get his Mogul balloon (already of highly questionable existence) up to the ranch using a number of extreme (i.e., improbable) assumptions, some of them never openly stated and deliberately hidden from the unsuspecting reader. (Incidentally, both Sparks and I have physics degrees, although all one needs to recreate Moore's model is high school math and physics to set up the equations and a spreadsheet like Excel to help crunch the numbers and graph the results.)
Moore also secretly contradicts some of his stated assumptions. More shocking, however, is that Moore's calculation of a trajectory from the table he sets up based on these assumptions is also mathematically bogus. The trajectory he plots in his book "exactly" to the Foster Ranch is not the trajectory one should get using his given values and then calculated using standard scientific practices. In fact, it contradicts the way he stated he was doing it! In calculating his trajectory improperly, Moore clearly destroyed the symmetry and correspondence that he had obviously built into his table and used data derived from another flight improperly, utilizing data in the opposite direction from the way he originally calculated it.
In another shocking misuse of mathematics, Sparks also discovered that Moore actually used a completely different set of balloon rise rates than the ones he indicated he was using in his table. This also alters the trajectory, but to a less profound extent than the miscalculation of his table. Nonetheless, these numerous, grade-school type math errors (like 100/12 = 350 !! ) indicate Moore was up to something other than good, hard science when he did his trajectory calculation.
However, unless one looks closely at his tables of numbers and assumptions (both stated and hidden), one might never suspect that Moore was deliberately force-fitting his trajectory rather than doing some "meticulous calculation" that placed the balloons "exactly" at the Roswell crash site. Thus it turns out Moore's trajectory is not so "likely" or "probable" after all, in fact, quite improbable. And the winds, rather than being "exactly right" or "positively allowing" Flight 4 to be the Roswell "culprit," might more aptly be described as "remotely allowing."
The main problem, as Moore himself readily admits in his book, is that there is no surviving flight data on Flight #4 -- no altitude data, no ground trajectory, no launch time, etc. Again, it is very questionable that there ever was a Flight #4, since it should definitely have been recorded in Mogul summary tables and reports had it existed, as all the other Moguls that flew actually were. Instead, what Moore has identified as "Flight 4" on June 4, 1947, was indicated in a diary of one of the scientists as being canceled because of cloud cover, just like an attempted flight the day before (the equally missing "Flight #3"). In fact, the CAA (FAA's predecessor) regulated these flights and had dictated that the flights had to be canceled if there was excessive cloud cover because of their potential hazard to aviation.
There is also very little weather data on which to base any sort of prediction. With many possible variables and little or no solid data to ground them in reality, it is possible to create almost any trajectory one likes. (In fact, one addendum to the main section shows two other "calculations" by myself using different sets of assumptions that steers "Flight #4" "exactly" to another balloon crash site described by one of the Roswell witnesses.)
Based on Moore's deception, a skeptical urban myth has arisen that Moore had shown how the already dubiously existing "Flight #4" would "likely" fly up to the Foster Ranch for rancher Mack Brazel to find, creating the crashed flying saucer "myth."
During this essay, we will examine not only Moore's deceptive and mathematically faulty "calculation" with its so-called "exact" crash site, but other, more likely trajectories, adhering to Moore's actual openly stated assumptions and actual flight data from other similar balloon flights, not improbable numbers that Moore made up to make his trajectory work. It turns out that when one applies Moore's basic model, but with more reasonable assumptions and correct math, even a real Flight #4 would have badly missed the crash site and ended up dozens of miles away.
This further explores what happens when Flight #4 is modeled more closely after Flight #5. Using
Moore's original post-dawn launch and adding the shortened flight time of Flight #5 to the model, the
balloons now miss by about 100 miles. Cut the descent winds, like on Flight #5, and the balloons still
miss by about 70 miles. Use Moore's extended flight time and cut the descent winds, and the balloons
end up about 30 miles east of Moore's site, the closest they would likely come to the Foster Ranch crash site even if Moore's strained assumption of a late night flight was correct.
July 8, 1947. He remembered finding a balloon crash site about 60 miles north of Roswell just off
the main highway, with both the military and rancher Mack Brazel there, or about 30 miles NE of the
Foster Ranch site. Was this the real final crash site of Flight #4, and did the military take Brazel there
to coach him in what to say later that evening during a press conference? Two sample trajectories are
generated that would have taken the hypothetical Flight #4 to Kellahin's site using fewer and generally
less extreme assumptions than Moore used. This still isn't a highly probable crash site, but still much
more probable than Moore's.
Predictability of Mogul Trajectories
Just how predictable would the balloon trajectories have been anyway? Original Mogul project
summaries said not very. Moore also coauthored a 1948 journal article which said the same thing
and gave an interesting example of the relative uselessness of wind data from surrounding weather
stations in predicting one early Mogul flight from July 7, 1947. Variability of wind data from this
flight is analyzed to justify some of the assumptions in plotting the two Kellahin site trajectories and
also plotting another "possible" trajectory to the Foster Ranch site. Nonetheless, any Foster Ranch
trajectory remains much less probable than trajectories taking the balloons further to the east and
north, such as the Kellahin site.
Main Essay
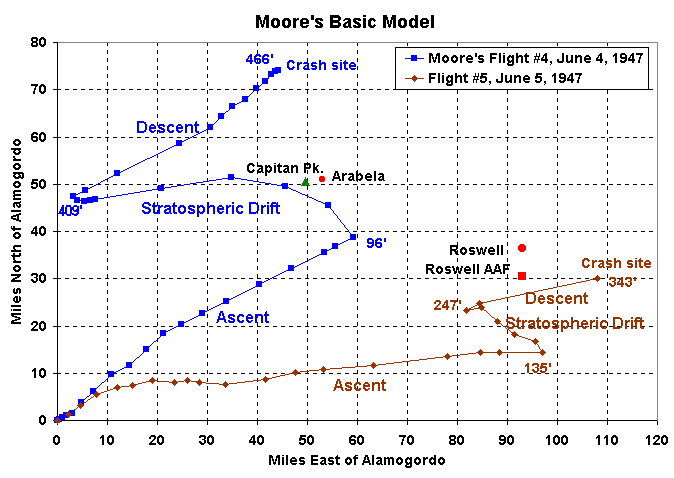
Moore's Basic Model
The following graphic shows Moore's proposed Flight #4 trajectory For comparison, Flight #5, the successful flight from the next day with surviving trajectory data is also plotted. Moore claimed to lean heavily on this flight in modeling Flight #4. Key times in the flights are provided alongside the trajectories, as are key landmarks. (To compare Moore's 1995 model trajectory with the 1997 one below,click here.
There are three basic components or phases to Moore's flight trajectory, as illustrated in the graphic.
1. The ascent phase after launch: The balloon train rises through the troposphere (lower portion of the atmosphere). According to Moore's wind data, the winds were blowing to the northeast and increasing in speed with altitude. At the end of the rising phase, the balloons have entered the stratosphere, and caught winds that take them back to the northwest (as happened with Flight #5). This is the first turn point in the trajectory. Moore insists that this turn must have occurred near Arabela and Capitan Peak (marked on plot), landmarks he claims he clearly remembers associated with Flight #4.
One important thing to notice here is how much shorter Moore made this phase compared to Flight #5, even though the winds he uses for #4 were actually about 9% greater on average than for #5.Note how he has the turn occur at only 96 min. into flight for #4 rather than 135 min. for #5. This shortens the ascent ground track to only 70 miles compared to 98 miles for #5.It is critical to understand how Moore rigged his numbers and calculation to drastically shorten this path. Had he actually adhered to a #5 flight profile and calculated correctly, the balloon's path on this leg should have been over 100 miles. It would have badly overshot Moore's critical turn point and made a mockery of his claim that the winds were "exactly right" to take the balloon near Arabela and Capitan Peak.
2. The stratospheric phase: This is where the balloons are carried back to the west by the slower stratospheric winds. This would be considered the constant altitude portion of the flight (the balloons carried ballast equipment to maintain them at a relatively constant altitude.) Moore has the balloons gradually rising and eventually catching stratospheric winds that also take them somewhat back to the south. This entire phase is very prolonged, much longer than in any of the other neoprene balloon Mogul flights.Compare, e.g., with the much shorter flight time and path taken.by Flight #5 during this phase. In order to create this highly prolonged westward drift, Moore did two highly questionable things: 1) He secretly cut 30-40 minutes time from both his ascent and descent and tacked them onto the stratospheric drift instead, and 2) In order to add 2 more hours, he flip-flopped from his 1995 position that the launch time was likely post-dawn and pushed it into late night using contorted logic about cloud-cover records and a surviving diary.
3. The descent phase: After the balloons deteriorate in the sunlight, some start popping and the balloon train starts descending. Once it drops back into the lower stratosphere (the second turn point), it picks up the northeastly winds again that carry it back to the northeast to its eventual crash point. Moore drastically shortened the descent by having #4 fall much faster than #5, a second way he prevented serious overshoot of his desired crash site.
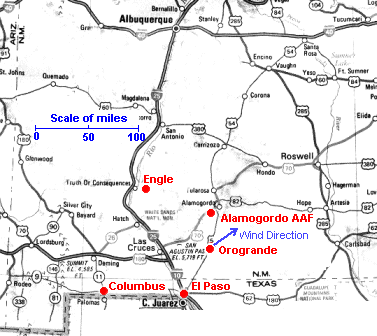
For winds in the lower atmosphere 46,000 feet and below, Moore used wind data from a White Sand's weather station located at Orogrande, about 32 miles south of Alamogordo AAF. Since Moore was using a launch time that didn't correspond to the actual weather data collection times at Orogrande, he interpolated wind results from June 3 and June 4, 1947.
Moore's major stated assumptions (and what he really did)
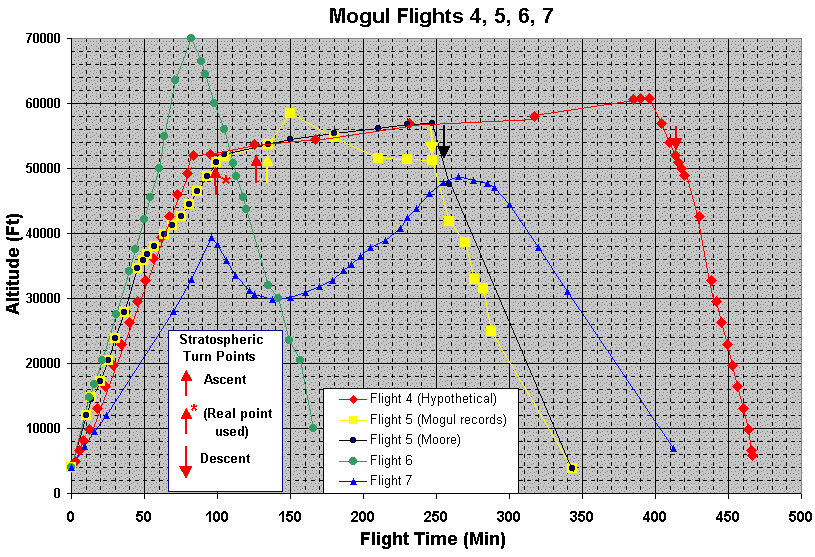
Many of Moore's stated and secret assumptions are summarized in the following figure, showing the altitude vs. time profiles for Mogul Flights #5 (yellow), #6 (green), and #7 (blue), the three early Moguls that used clusters or trains of neoprene weather balloons. In addition, Moore's hypothetical Flight #4 is plotted (red) and Moore's revised Flight #5 (black).
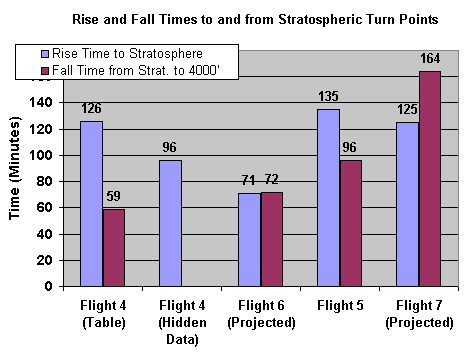
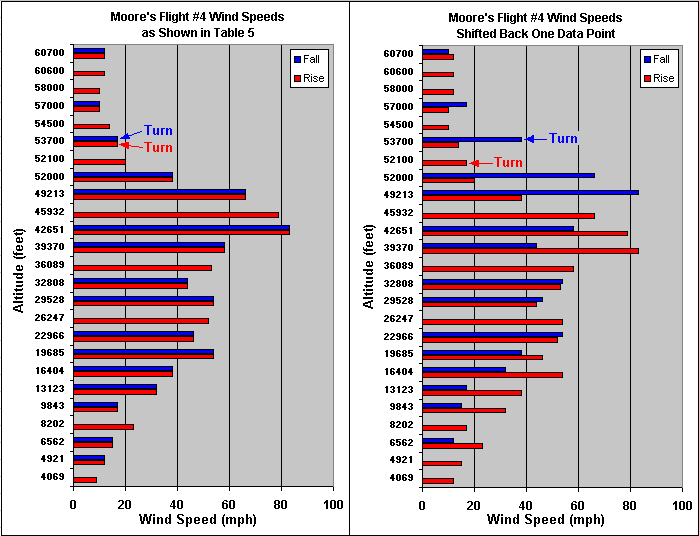
The overly fast rise and fall times are also summarized in the bar graph at the right comparing Flight #4 to the other three neoprene balloon Moguls of June/July 1947. This will be discussed in more detail later on.
Note again the difference between Moore's table rise time (blue bar) for Flight #4 versus the one he really used (labeled "hidden data") and compare it to the actual value for the real Flight #5. Also note the drastic difference between fall time (brown bar) he uses for #4 and the other balloons.
The very fast rise time coupled with the early, secret turn to the west, the extra time in the stratosphere, plus another secret assumption of Moore's of the wind velocities in the stratosphere being about 10% greater on average than on Flight #5, have a total effect of pushing Flight #4 over an extra 30 miles back west before it begins its descent. Obviously without these unstated assumptions, Flight #4 would have ended up over 30 miles too far east at the end, leaving all of Moore's other assumptions untouched.
Moore Flip-Flops on Launch Time to Extend Balloon Flight
The extra stratospheric time is on top of Moore's stated extra 2 hours that he got by advancing the flight to 3:00 am, instead of the usual just-after 5:00 am post-dawn launch time. This was in contradiction to Moore's 1995 model. Back then he said that a surviving diary entry indicating the flight was initially canceled on account of clouds indicated that Flight #4 probably would have been launched post-dawn, just like similar Flights #5, 6, & 7. (Moore spinning the weather data to justify the earlier launch time will also be dealt with in detail later in this essay.)
Moore Force-Fits Trajectory to Conform to an Assumption
Another stated Moore assumption was that the flight took a track that he remembered, passing near Arabela and Capitan Peak, where he claims he remembers they lost contact. In order to take this track, the balloons had to fly to the NE during ascent, then backtrack towards the west in the stratosphere. Thus, the balloons had to make their first turn near Arabela. This is, in fact, Moore's primary constraint on his trajectory.Moore literally force-fits this turn, first by having an ascent that was overly fast compared to Flight #5, and when that proved insufficient, improperly calculated his table and pushed the turn to the previous point so that the balloons had to turn there. Thus it turns out that winds were not "exactly right" to take the balloons to the "Arabela area." What actually happened is that Moore rigged the numbers to make doubly sure the winds took them there. Had he not done this, the winds would have caused the balloons to overshoot this point by over 30 miles. This is discussed in detail in the next section.
Moore's Fuzzy Math
This section deals with how Moore's improper mathematical handling of his own table drastically alters the plotted trajectory. Thus even if one granted every one of Moore's highly questionable assumptions of overly fast rise and fall along with very prolonged stratospheric drift, Moore's trajectory would still badly miss the mark because his math is wrong. Furthermore, as elsewhere, what he said he did isn't what he actually did. Moore calculated his trajectory differently from the way he said he was doing it.
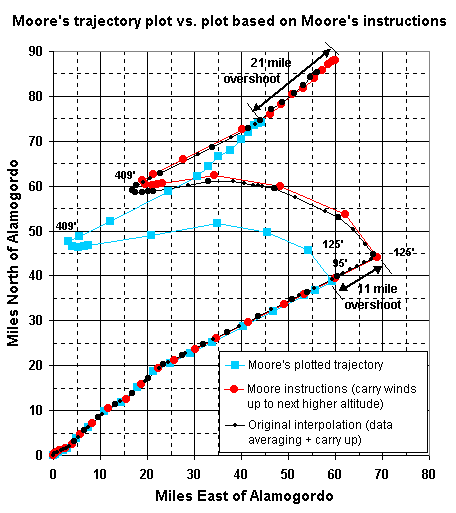
The next graph plots the trajectory Moore has in his book(light blue). In addition I entered Moore's Table 5 data and appropriate formulas into an Excel spreadsheet, using his given times, altitudes, and wind velocities. Moore's table footnotes state that he calculated x & y (i.e. east/west and north/south) displacements by multiplying the velocity in an altitude interval times "the time interval required for the balloon train to rise through the specified layer." In other words, Moore said he was applying the velocity at lower altitude upward through the next higher altitude.This would also have to be done on both the rise and fall sides of the trajectory to maintain the symmetry of wind data Moore had built into his table (wind values at a given altitude were exactly the same on rise and fall). This would likewise maintain the correspondences Moore had built into his table between Flights #4 and #5 for wind data above 46,000 feet, such as identical altitudes at which the balloons turned.
These latter details of maintaining symmetry and correspondence are vitally important, because as it turns out, the way Moore actually handled his table ended up corrupting his own data.
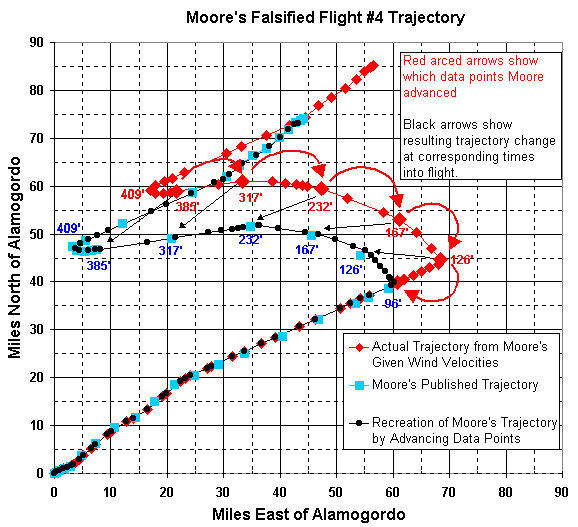
However, when one runs the trajectory calculation the way Moore claimed he was doing it, the trajectory is not the one Moore had in his book, but the red one. It is a completely different trajectory, overshooting his first turn point by about 11 miles and overshooting his alleged crash site by about 21 miles to the northeast.
A mathematically equivalent way of stating what Moore did was to carry all his velocities backwards through the previous data point. When I first discovered the huge discrepancy between Moore's plot and a correctly calculated trajectory, I was enormously confused (not to mention shocked). How exactly did Moore get his table plot?
I then attempted to discover how Moore had plotted his trajectory. I found that I could get Moore's first turn point at 96 minutes into flight by replacing his 96 min. table data point, which still had a wind velocity to the NE, with the next table data point at 126 min., where the winds shifted to the NW. In other words, I had to advance the data point by 30 min., cutting short the NE drift by half an hour.
However, even after doing this, Moore's table and graphical trajectories still did not match in the mid-portion and end of flight. I then found that if I advanced the next 4 data points, I got a trajectory that was very close to Moore's, but not exact, as depicted in the next graph from the previous version of this essay. Overall 5 data points between 126 min. and 385 min. (over 4 hours of flight) were pushed forward one notch and replaced data points between 96 min. and 317 min. Everything else stayed the same.
The bar graph makes it clearer how Moore accelerated both the rise and fall times for Flight #4 compared to Flights #5-#7. Moore's ascent time of 126 min. for Flight #4 isn't that different from that of Flight #7 (125 min.) and Flight #5 (135 min.) and could be considerd to be a reasonable assumption, but Moore secretly advanced #4's ascent time by 30 minutes to 96 minutes (second blue bar) through improper math methods.
However, we are most concerned here with the descent phase of Flight #4. Note how Moore has #4 falling to the ground much faster than the other three real flights. Even though Moore says he modeled #4 after #5, #5 took 96 minutes to drop to the ground, whereas Moore has #4 taking only 59 min., 39% less time. Moore even has #4 falling 18% faster than the defective #6 (59' vs. 72'.)
A far more reasonable assumption would have been to use Flight #5's fall time, or maybe some sort of mean value for all three known flights. But Moore didn't do that, for the simple reason that #4 would have badly overshot Moore's desired crash point, even if we accept all of his previous bogus manipulations of the trajectory. Again he was flagrantly force-fitting the trajectory.
A More-Likely Flight #4 Trajectory
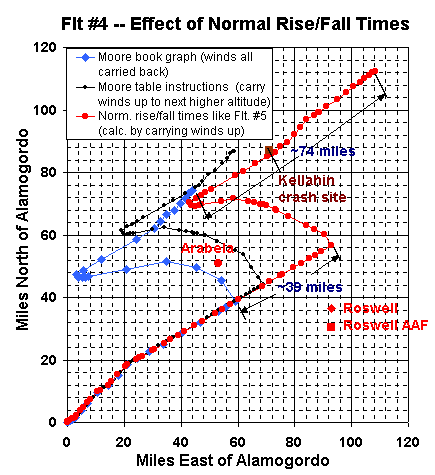
In the next graph, I have plotted a trajectory for Flight #4 using Moore's basic model, his given table wind data calculated correctly by carrying wind values up through the next altitude point as per his own table instructions (not advancing data points like Moore actually does), and substituting the actual slower rise and fall data of Flight #5, the flight Moore claimed he was modeling Flight #4 after, but didn't. All of the rest of Moore's assumptions remain the same, including the extended flight time by moving the launch time back to late night instead of dawn.
As might be expected, the much longer rise time of Flight #5 (135 min. vs. 95 min. used by Moore for Flight #4), causes the "real" Flight #4 trajectory to badly overshoot Moore's turn point.In the calculation above, the overshoot is about 39 miles. In a previous calculation (done by averaging adjacent points), the overshoot was less, "only" 32 miles. Nonetheless, it is clear that when calculated correctly, the turn point is nowhere near where Moore plots it.
What about Moore's Sci Fi channel statement tthat the winds "were exactly right to carry the balloon from Alamogordo to the Arabela area?" It is obvious nonsense. If anything, the balloon would have turned much closer to Roswell, and on its westward trek would have gotten no closer than 20 miles north of Arabela. When the trajectory is correctly plotted out, it becomes highly obvious why Moore didn't use the successful ascent profile of Flight #5, resorting to back-room tactics instead to force the early turn.
Because an extra 40 minutes was spent during ascent, this 40 minutes comes off of Moore's stratospheric phase. The balloons end up drifting about 40 miles less to the west than Moore has them doing and also end up about 24 miles further north before they make their second turn while descending and head back to the NE.
During the lengthier descent (96 min. vs. Moore's 59 min.), the balloons travel about 77 more miles during the drop phase vs. 49 miles in Moore's model. This is an additional 28 miles of overshoot.
Overall, this more realistic simulation, adhering closely to Moore's stated assumptions, results in the balloons crashing about 74 miles NE of where Moore places them and about 70 miles to the north of Roswell. Calculating using data point averaging (as previously done here) results in a slightly shorter overshoot of "only" 67 miles. It is clear that when Moore's table is calculated correctly and according to his stated assumptions, the miss is huge and on the order of 70 miles.
Further down, we will also explore what happens when normal flight time is added into the model. The miss becomes more like 100 miles.
One more point is to notice is how the correctly plotted trajectory passes directly over what I call the "Kellahin crash site." This is a balloon crash site that AP reporter Jason Kellahin claimed to have seen while driving from Albuquerque to Roswell to cover the Roswell "flying disk" story on July 8, 1947. Were the winds to drop in half on the descent side (as they apparently did for Flight #5 the next day), the balloon would have ended up very close to the Kellahin site, even with Moore's assumption of late night launch and grossly extended flight time.. Other trajectories to the Kellahin site, all much more likely than Moore's trajectory, are discussed in an addendum section.
Other Moore assumptions
This essay has focused primarily on the assumptions, overt and hidden, that most strongly affect the trajectory in Moore's model. Other modifications to other of Moore's assumptions could be made to make the model more realistic and more reasonable.
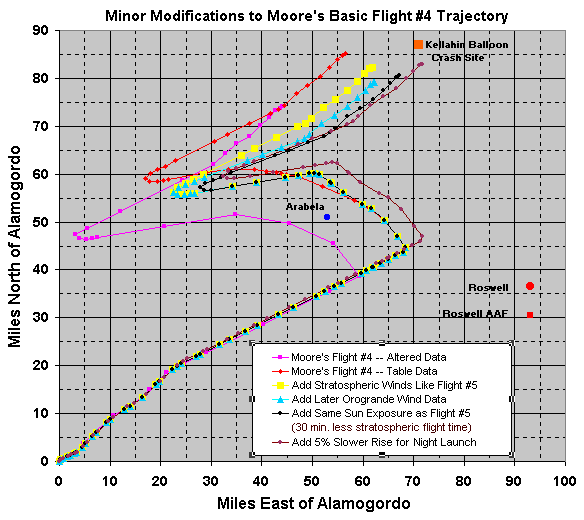
The following figure summarizes the effects on trajectory of various minor modifications to Moore's basic model. As usual, Moore's Flight #4 table data (red) and his secretly altered trajectory (violet) are also plotted for comparison. To simplify the plot, the first modification is added on to the trajectory predicted by Moore's table data (red). Each subsequent modification is then added to the previous one to show the relative changes in trajectory wrought by each new modification.
(This was forced by the Orogrande wind set having more westerly winds than the ones Moore apparently guessed in 1995, which would have pushed the balloons much further east then Moore desired. To get them back west, he needed a much longer time aloft. Compare his 1995 and 1997 trajectories here which show the dilemma Moore faced.)
The map at the right shows the locations of the various weather stations Moore mentions in his book. Note the Orogrande station south of Alamogordo with the prevailing wind indicated blowing to the Northeast. (This is the station where Moore got the bulk of his wind velocity data.)
The following table summarizes the cloud data from the other stations that Moore provided in his book:
Now here's how Moore tries to finesse this data into a 3:00 AM launch time (p. 102):
"There are, of course, many uncertainties associated with this analysis of the 4 June events.
The launching time is not known, but given that Crary's diary shows that he was ready for
the launching soon after midnight on 3 June, and given that the clouds that caused the launch
delay went away at around 0230 MST on 4 June, I am sure that we would have launched
as rapidly as possible thereafter."
First of all, Crary's diary does not say they were up "soon after midnight" on June 3. He said they were "up at 2:30 AM." [Note how Moore tries to spin this to push times back by about 2 hours.]
Moore made a similar deceptive statement in his Sci Fi Channel interview in 1997. He stated, as if it were an established fact, that Flight #4 was launched at "about" 3:00 AM, and then added that it was launched "about the same time of the day" as Flight #5 the next day. Well hardly, since Flight #5 went up at 5:16 AM.!
"About the same time" in MooreSpeak seems to mean within two and a half hours of a given time. This semantic imprecision seems very calculated, designed to provide Moore the time "slop" he needs to get his model to work. It also seems designed to sound like he was adhering to a Flight #5 profile, when he is actually doing nothing of the sort.
Secondly, only two years earlier, Moore had interpreted Crary's entry for June 3rd that they were up for launch at 2:30 AM as implying they were similarly up for launch at around 2:30 on June 4 (not "soon after midnight"). Furthermore, Crary's first entry for June 4 indicated the flight was initially cancelled on account of clouds. In other words, Crary's diary actually suggested that it was still cloudy at 2:30 AM in Alamogordo, probably reflecting the cloudy conditions upwind at Columbus, N.M., recorded 3 hours earlier. (In fact it was still partly cloudy in Alamogordo at 7:30 that morning.)
It is true there was a clearing trend by around 2:30 at other weather stations. But Moore in 1997 failed to take into account the obvious delay in any such clearing due to the distance of Alamogordo from these weather stations. The Columbus weather station is a particularly good model for cloud conditions because on June 4 it probably would have been directly upwind from Alamogordo. Columbus recorded 40% altostratus cover at 11:14 PM the previous night. But Columbus was 130 miles away. The altostratus clouds would have been at an altitude where Moore's wind data indicates winds of 40-50 mph. Thus one would expect a delay of 2-1/2 to 3 hours for the same cloud layer to blow through Alamogordo. The 40% cloud layer at 11:14 PM in Columbus would have reached Alamogordo by around 2:00 AM. And by the same reasoning, the clearing skies noted in Columbus at 2:11 AM wouldn't have been reflected in Alamogordo until around 5:00 AM.
Thus Crary's diary and the cloud weather data actually supports the scenario of a flight cancellation at 2:30 because of clouds when they first got up to launch , but a later launch after 5:00 AM when it began to clear. This was actually Moore's original position in 1995, before he found debunking religion and started outrageously spinning the data.
Of course, if Flight #4 was launched soon after 5:00 AM, just like Flights #5 - #7, then Moore no longer has a leg to stand on when it comes to extending Flight #4's time aloft by another 2 hours. As a result, another 2 dozen miles or so would have to be chopped off of Moore's stratospheric trajectory to the west and added on to Moore's "miss distance ".
Without any justification, Moore used stratospheric winds about 10% greater and with some slightly different directions than on Flight #5. Make these winds like that of Flight #5, and the crash site would be pushed about another 6 miles further east and 3 miles more to the south, as shown in the yellow plot compared to the red plot.
Moore used the same set of wind data during descent as he did during ascent. But over 6 hours had elapsed since his launch time, and Moore should have reverted to the 9:30 a.m. wind data set from Orogrande, instead of reusing his interpolated 3:00 a.m. data set. The winds had shifted slightly to a more easterly direction during this period. If the 9:30 a.m. winds are substituted for the interpolated winds, the balloons end up about 3 miles further south, as shown by the blue plot. (Again, note this is added on to the previous modification to show the relative offset.)
Moore also secretly tacked on about another 30 minutes of stratospheric flight time at the "back end". If this was removed (balloons start breaking after equivalent exposure of sunlight as Flight #5), then the balloons would have ended up yet another 5 or so miles further east and 2 miles further north (black plot)..
Moore pushed the launch time back to late night by 2 hours. Without exposure to sunlight during the ascent phase, the helium gas would have been cooler and the balloons would have had less lift, slowing the ascent. I would guesstimate the ascent time would have been lengthened by roughly 5%. Using this estimate, another 6 miles would have been tacked on to the northeasterly ascent before the balloons made their stratospheric turn. Ultimately this causes the balloons to end up yet another 5 miles or so further to the east and about 3 miles further north (brown plot).
(It is possible that Moore actually took this into account in the initial rise phase of his balloons, because he does have them initially rising slower than Flight #5 by about 5%. However, this should have been carried through the entire rise phase, including after lifter balloon cutoff, which Moore quietly eliminated. Had he done this, the rise portion of Flight #4 would have been even longer than that of #5, instead of much shorter.)
None of these modifications alone results in big changes to the final crash site, but collectively they start to add up to something significant. Note that when all of them are added together, ultimately the crash site is pushed about another 15 miles further east compared to the trajectory predicted by Moore's table data (compare endpoints of brown and red plots).
(Interestingly, these various modifications again cause the trajectory to creep closer to the "Kellahin balloon crash site," marked on the above plot.)
Although some of these model modifications push the trajectory in opposite directions in the northward/southward direction, and therefore tend to compensate for one another, the same is not true for eastward/westward changes. In fact, just about any modification one makes to Moore's model to make it more realistic ends up pushing the balloons further to the east.
This is an important point, because it means Moore's model is "brittle." Unlike a robust model, errors in Moore's assumptions do not tend to cancel one another, but instead tend to be additive.He has to get literally everything right to get his little lost Mogul balloon up to the Foster Ranch. This means his trajectory is ultimately highly improbable.
So far this section has dealt with the more minor assumptions. One assumption that has a very big effect on the trajectory, and is absolutely crucial to Moore's model, is his extended flight time and time spent drifting backward in the stratosphere. If this was removed and Flight #4 followed a Flight #5 rise, fall, and time aloft profile instead, it turns out the balloons could have ended up over 100 miles to the ENE of the Foster Ranch crash site! This will be shown graphically further below.
Another assumption that hasn't been dealt with yet but has a huge effect on the final trajectory concerns just how high Flight #4 got. Moore assumes it went high enough to catch the slow westerly stratospheric winds, instead of continuing to drift at higher speeds to the NE. Moore, in fact notes that had Flight #5 not reached these stratospheric winds, it would have been blown about another 150 miles beyond where it ended up. What's true for Flight #5 is more than doubly true for Moore's Flight #4 model, since Moore had it drifting in the stratosphere for some 5 hours compared to about 2 hours for #5. If #4 hadn't reached the stratospheric winds, it would have been blown for 5 hours in the upper troposphere at typical speeds of around 60 mph, enough to push it roughly another 300 miles to the NE. It would have ended up in Kansas!
Flight #7, e.g., a July 1947 neoprene flight, did not get high enough to catch the stratospheric winds, and neither did the rest of the non-neoprene Moguls in July. So it is certainly conceivable that Flight #4 also failed to reach the altitudes Moore presumes and took a radically different track.
However, for once, Moore's assumption of stratospheric flight is not an unreasonable one, since both Flights #5 and #6, the ones that Moore says were similarly configured to Flight #4, both reached the stratosphere and had trajectories showing the backward drift.
Whether the Weather
What is more questionable is Moore's assumption that Flight #4's stratospheric journey was so much longer than the other flights. Moore needs this very prolonged phase to try to push the balloons as far back as he can to the west and also to the south before they drop (and as we saw previously, was unsuccessful in doing even that openly and honestly).
In Moore's 1995 model, Moore assumed that Flight #4 was launched soon after dawn, just like the other 3 early neoprene Moguls, based on weather data and the following entries in the diary of Dr. Albert Crary, a geophysicist working with Project Mogul, and who was also setting up explosive charges to test Project Mogul's sensing gear:
"June 3 Tues. Up at 2:30 AM ready to fly balloons but finally abandoned due
to cloudy skies. I went out to Tularosa Range and fired charges from 6 on to 12.
Missed 5:30 shot--trouble getting ordnance man--"
"June 4 Wed. Out to Tularosa Range and fired charges between 00 and 06 this
AM. No balloon flight again on account of clouds. Flew regular sonobuoy
mike up in cluster of balloons and had good luck on receiver on ground but
poor on plane. Out with Thompson PM. Shot charges from 1800 to 2400."
To this Moore originally wrote (Mar 16, 1995, "The New York University Balloon Flights During Early June, 1947" p. 4):
"One interpretation of the June 4 entry is that the launch scheduled for shortly
after 0230 MST was canceled because of clouds but, after the sky cleared around
dawn, the cluster of already-inflated balloons was released, later than planned."
Essentially the same Moore account and quote also appear in Pflock's book (p. 154). To some, this may seem a not unreasonable conclusion. First the scheduled flight was scrubbed on account of clouds shortly after 2:30 AM, but later it cleared sufficiently for them to go ahead anyway with some sort of launch. However, whether it was a fully configured Mogul, like Moore assumes, or a stripped-down test flight of equipment is a matter of heated debate. Crary's diary would seem to indicate this was a stripped down flight designed only to test sonobuoy reception. This is also supported by the total absence of any records on the supposed "Flight #4", meaning it never flew. ALL flown constant-altitude flights were recorded, but not Moore's alleged #4.
Furthermore Crary's entry that they were up at 2:30 AM on June 3 ready to launch suggests a similar time for June 4, which even Moore used as the intended launch time in 1995 This point becomes important later as Moore tries to spin the time issue in his 1997 book model.
Moore added that another interpretation would be that there had been no launch at all, because Crary's diary entries were "contradictory."
So what changed between 1995 and 1997 to require the launch time be pushed back to 3:00 am? Probably nothing except the realization by Moore that he had no hope of getting his alleged Mogul up to the Foster Ranch with his model unless he could somehow rationalize an extra long flight time compared to the next three neoprene balloon Moguls.
I then said that the changing of one data point in his table could have been a simple misprint, but the changing of 5 data points was hard to explain away in an innocent manner. To me it seemed to be a very deliberate behind-the-scenes manipulation of data. I accused Moore of hoaxing his own model.
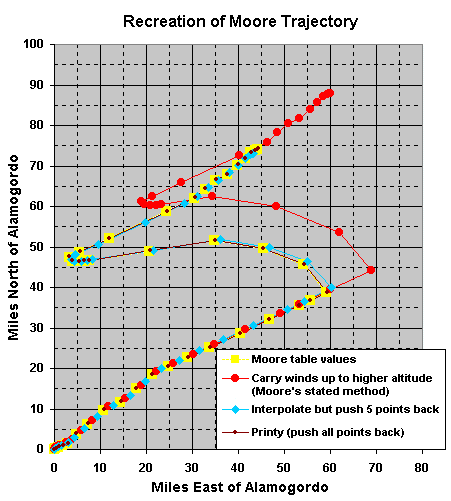
Recently some debunkers have counterattacked on behalf of Moore. According to debunker Tim Printy, Moore didn't push just a few points back, Moore pushed them all back. This replicated Moore's trajectory (except, as it turns out, Moore's first few x & y points). This is graphed below, showing Moore's trajectory (yellow), what you get if you push all data points back (Printy, black)), how I tried to recreate Moore's trajectory (blue) pushing back only 5 points in the midportion (extra interpolation points have been removed for clarity), and Moore's stated (but not used) method of calculation (red), which also happens to be one of the mathematically correct ways to run the calculation.
Printy was undoubtedly right that this was the way Moore had really run the table. He then proclaimed himself victorious. Moore had hidden nothing, it was I, not Moore, who was in error, and that Moore was completely exonerated.
Another debunker to proclaim himself victorious was Dave Thomas of the New Mexico skeptics, who personally attacked me in the March/April 2003 issue of the Skeptical Inquirer. Like Printy he simply recreated Moore's bogus trajectory, claimed this vindicated Moore, and then labeled me "incompetent."
(For my rebuttal sent to the Skeptical Inquirer, click here.)
The problem for both Printy and Thomas is that they repeated Moore'sincorrectcalculation instead of doing it right. But repeating mistakes doesn't make them right no matter how many times they are repeated. They merely recreated how Moore had gotten 2 + 2 = 3 instead of realizing that Moore should be getting 2 + 2 = 4. It was hardly the point if my recreation of Moore's method got 2 + 2 = 3.1 instead of 2 + 2 = 3.
In true dishonest debunker tradition, they also deliberately avoided discussing the key math points proving Moore calculation wrong. The most important of these were: 1) Moore didn't even do the calculation the way he claimed he was doing it, and 2) the way Moore actually did the calculation was also mathematically and scientifically wrong. (To this one can add that Moore violated his own assumptions in setting up his table to begin with using overly fast rise and fall rates).
The arguments detailing what is mathematically bogus about Moore's calculation have already been touched upon on the UFO Updates discussion list.But in brief, here is what is clearly wrong with Moore's backward method of calculation.
1.It is completely contrary to the way Moore claimed he was doing it, as already dealt with above. Had he actually done it according to his own instructions, he wouldn't have caused the following serious or fatal mathematical problems.
2. Pushing all data points back throws out the first data point at time t = 0. Thowing out one's own data is a very "unusual" way of dealing with it, to say the least, though not necessarily fatal. (Except, as it turns out, Printy himelf also found that Moore did something else entirely making even less sense. Moore instead mixed the speed value at time 0 with the direction value at the next data point to get his mysterious first position point. Another way to look at it is Moore threw out both the wind direction value at time 0 and the wind speed value from the next point, then combined the two remaining wind values to calculate his first trajectory point to form some sort of spliced together mutant hybrid of a data point. This is also a rather "unusual" way of dealing with the data, in fact completely invalid. Any math teacher would cringe. But the fact that it was obvious mathematical nonsense didn't seem to bother Printy in the least. Again all he seemed to care about was reproducing what Moore had done rather than questioning whether it was valid or not.)
3. Moore built an obvious symmetry into his table for Flight #4. Wind speeds and directions for altitudes on the way up and on the way down corresponded exactly. But carrying wind data back through the previous interval pushed wind values to the next lower altitude on the way up, and to the next higher altitude on the way down destroying his own table symmetry. This is one way in which Moore corrupted his own data. (It is also why Moore's actual method of pushing back all data points is even more damaging to his own data than if Moore had pushed back only a few of his points, as I thought he had done.)
(If this is confusing, the linked list of table data is like a rope over a pulley, with the rope on one side of the pulley being the rise values and the rope on the other side the fall values. Pulling the rope down a notch on one side simultaneously pulls the rope up a notch on the other side.)
The following bar graphs summarize the table data and show the effect of carrying the wind data backwards.. On the left are the listed Flight #4 table wind speeds vs. altitude with the rise and fall values compared side by side. It is immediately evident that the wind speeds in the table on rise exactly match those on fall for a given altitude. But when the wind values are carried back, none of the wind speeds for a given altitude match up any more. The wind data symmetry is destroyed and the data corrupted.
The Phony Mogul Balloon Trajectory
How a debunker scientist "cooked the books" to support his pet theory
Copyright 2002 by David Rudiak
Last updated on: April 5, 2024
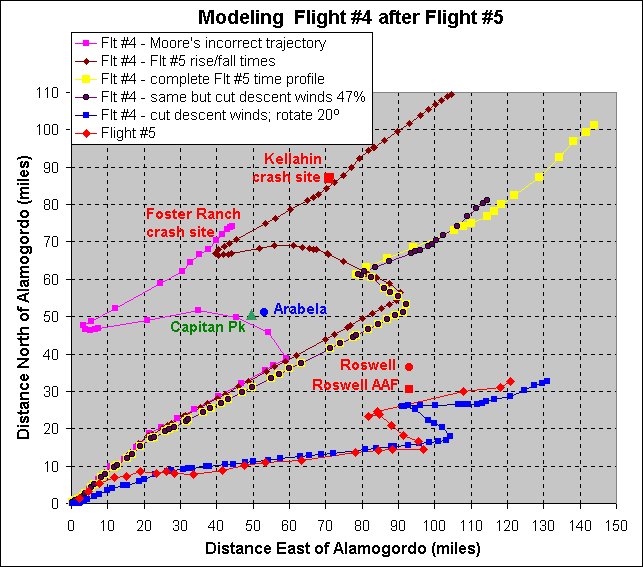
Other possible model Flight #4 trajectories (including the effect of normal flight time)
In this section, we will model Flight #4 very closely after Flight #5, looking primarily at how a flight time like that of Flight #5 would affect the trajectory of a model Flight #4. In other words, we will ignore Moore's rather strained assumption of a late night launch and extended flight time and go back to Moore's original assumption that Flight #4 was launched post-dawn, just like the other early flights. Also we will actually adhere to Moore's "perfect flight" assumption, as good or better than the real Flight #5, the true historical first successful constant-altitude N.M. flight.
In the following trajectory plots, Flight #4 uses the same flight time profiles and stratospheric winds as Flight #5, but retains its own lower atmospheric winds, which are rotated more to the north than #5. Also, on the descent portion, more westerly winds from several hours later have been spliced in, instead of Moore using the exact same winds on ascent and descent. As usual, Moore's incorrect Flight #4 trajectory is plotted (purple), with its bad math, extended flight time, and bogus, internally altered rise and fall times. Also for comparison, Flight #5's trajectory the next day is plotted (red).
The first Flight #4 trajectory uses Flight #5's rise and fall times, but retains Moore's pre-dawn launch and extended flight time (brown). This was also plotted above in a previous section. The balloons end up overshooting the Foster Ranch crash site by about 70 miles.
In the next plot (yellow), the model uses a complete Flight #5 time profile, including the much shorter stay in the stratosphere (about 2 hours vs. 5 hours). Because this model flight is launched post-dawn, about 2 hours later than Moore's late night launch, the ascent winds are slightly more easterly by about 2 degrees, and this has been added into the model, rotating the trajectory 2 degrees clockwise from the earlier launch trajectories. These balloons ends up over 100 miles east of the Foster Ranch crash site!
The next plot (black) tries to make the model even closer to that of Flight #5. Flight #5 had a much shorter descent path than would be predicted from its ascent. #5 fell about a third faster than it rose, but the rest of the short descent path can only be explained by sharply reduced winds. It turns out the winds during fall were only slightly more than half of those on rise (about 53% to be more precise).
Thus reduced descent winds have been added to the model in this plot. The new crash site is still about 70 miles east of the Foster Ranch site.
(As previously noted, if the same reduced descent winds are applied to the brown trajectory with Moore's extended flight time, the crash site ends up a few miles east of what I call the Kellahin crash site and about 30 miles east from the Foster Ranch crash site. This is about as close as Flight #4 would have come to the Foster Ranch using any reasonable set of assumptions and on the off chance that Moore's assumption of an extended late night flight was correct. (This alternate Flight #4 crash site scenario is dealt with in more detail in the addendums.).
In the final plot (blue), the previous trajectory has been rotated 20 degrees clockwise to better compare it to that of Flight #5 (red). As can be seen, the trajectories would have been very similar when #4 is modeled exactly after #5. The main difference shown is that the winds for Flight #4 would have been slightly stronger (by about 9%) than those for Flight #5, and #4 would have ended up about 9% further away from the launch site (under the conservative assumption that the winds dropped in half during descent like they did for #5).
The key point is that Flight #5 ended up about 110 miles from its launch point at Alamogordo, while an exactly matched Flight #4 would have ended up at least 120 miles away. But Moore's model cuts the distance to the Flight #4 crash site even further to only 85 miles so that it lands "exactly" on the Foster Ranch.
This alone is a big red flag that something is very odd indeed about Moore's model. The distance to his #4 crash site is much closer than one would expect had he actually adhered to his stated assumptions of best equipment and similar balloon configuration and performance as Flight #5.
Thus, although Moore claimed to be closely modeling #4 after #5, his crash site is much too close and his trajectory very different from any of the trajectories that adhere more closely to a #5 time and wind profile. To cut the distance to the crash site, Moore drastically shortened both his ascent and descent trajectories through stealth means by treating the balloon as faulty and giving it overly fast rise and fall times, and then adding a bogus math calculation of his table to cut the ascent trajectory even further.
Another way to look at the problem is that Moore used the wrong elapsed times to reach a given altitude (thus the rise rates when calculated with the wrong times would disagree with the printed rise rates). The table can be easily recalculated using Moore's given rise rates and altitudes to find new "corrected" elapsed times. From this, a new trajectory can be calculated that Moore should have gotten had he stuck to his printed rise rates. If one uses Moore's faulty push-back method of calculating the trajectory, the final crash site then lies about 5 miles south of Moore's site obtained with his altered rise rates or times.
It's difficult to understand why Moore would do this. One can speculate that the reason Moore secretly changed many of his times/rise rates was to "fine-tune" his trajectory. Five miles off still wasn't considered good enough, so Moore perhaps "tweaked" the elapsed times/rise rates to make sure the balloons ended up exactly where Moore wanted it. When Moore said he had "calculated" a trajectory "exactly" to the Foster Ranch he meant "exactly."
Even if this is what happened, it is still difficult to comprehend why Moore would bother. He could have called his five mile miss "close enough" or "fixed" his little trajectory problem in other ways without resorting to piling more math errors on top of his previous ones.
Regardless of the reasons for these bizarre, grade-school math mistakes, they represent just one more instance where Moore claimed to be doing one thing while doing something else entirely. He brazenly force-fit a trajectory using made-up numbers at odds with his stated assumptions and improper math calculations.
Using such methods, he deliberately and improperly forced an early turn to conform to his assumption that the balloon trajectory had to match his 50-year-old memory of the flight passing near the town of Arabela and Capitan Peak. Moore explicity referred to this as one of his "constraints" on the trajectory (p. 102). (See also his 1995 model in which he is obviously assuming winds that would have taken the balloons directly to Arabela/Capitan.)
This also improperly added extra time to the stratospheric drift and prematurely advanced data points further down the line. This together with slightly increased stratospheric wind speeds push the stratospheric trajectory further west and south than they should have gone before the balloons started to fall out of the stratosphere and drift back NE to Moore's desired crash site at the Foster Ranch. Moore's manipulations are designed to line the balloons up for the final descent phase and give them as much room as possible in which to do it.
But even with all of this improper treatment of data, there still wasn't sufficient space for the balloons to descend in a reasonable time without still badly overshooting the ranch. So at the very end, Moore resorted to dropping them much faster than any of the other neoprene balloon Moguls, as can be seen by referring back to the original graph of altitude vs. flight time.
Moore's Flight #4 Death Dive
In the following bar graph (also shown above), the ascent times and descent times for Flights 4-7 are again plotted. Rise and fall times were defined as the times required for the balloons to move between ground level to where they made their stratospheric turns, either on ascent or descent. In some cases, the times had to be extrapolated. To facilitate comparison of relative times, rise or fall time trajectories were extrapolated to the same elevations in some cases. E.g., Flight #7 never made it to the stratospheric level where the winds shifted direction. So the ascent and descent trajectories where extrapolated to the 53,700 foot level where Flight #5 changed directions and where Moore's table has #4 changing directions as well . Also, to facilitate comparison, descent trajectories were extrapolated to the same crash elevation as Flight #5 (about 4000 feet), and total descent times determined to that elevation. So, e.g., about an extra 2 minutes had to be added to Flight #4's descent, since Moore had it crashing at about 6000 feet.
4.A consequence of the third point, is that Moore now has his Flight #4 turning at two completely different altitudes on rise and fall (also marked on right bar chart). Consult the table for Flight #4 again and you will see the sharp change in wind direction (azimuth) from the lower atmosphere at 53,700 feet on the way up and 54,000 feet on the way down, or essentially the same turn altitude. (Turn altitudes marked on left bar chart above.). But in destroying table symmetry and pushing down his winds on the ascent side, Moore shifted his ascent turn point down to 52,100 feet. Instead of only 300 feet apart, now the turn points are nearly 2000 feet apart in altitude. (Printy himself noticed the mismatch, but instead of treating it as an obvious red flag that something was wrong with Moore's method of calculation, simply dismissed it from his mind in an e-mail saying that Moore must have had a "good reason" for doing this.)
5.. Above 46,000 feet, Moore obviously modeled his upper atmospheric wind data after that derived from Flight #5.In another table, Moore used old data from Flight #5 to calculate average wind speeds and directions between successive data points. Butin pushing back the data points, the same wind values applied to Flight #4 were used in the reverse direction during ascent from the way Moore originally calculated them for Flight #5. Instead of being carried forward from one data pont to the next (i.e. to the next higher altitude), Moore has them carried backward, from one data point to the previous one (to the next lower altitude).
6. A consequence of point 5, and similar to point 4, is that Moore's backwards shift also destroyed the exact correspondence in turn altitudes Moore had between Flights #4 and #5. Instead of both making their first stratospheric turn at 53,700 feet, Flight #4 got pushed down to 52,100 feet and back 30 minutes in time.
Any proper way of calculating the trajectory demands that the symmetries and correspondences built into the table be maintained rather than destroyed. Furthermore, the upper wind velocities should be carried forward to the next higher altitude in the same manner in which Moore originally calculated them for Flight #5 (and claimed he was doing for Flight #4, but didn't) instead of being pushed back to a lower altitude, as Moore actually did in running his table calculation.
Mathematically points number 3, 4 and 5 are absolutely fatal to Moore's actual method of calculation and totally invalidate it. (Not even to mention point 1, that Moore didn't even calculate the way he said he was doing it.)
Point 6, while not necessarily a fatal mathematical flaw, actually has the most serious consequences on the overall trajectory. Because Moore's previous point is 30 minutes earlier, the first big turn in the trajectory also gets pushed back 30 minutes, substantially foreshortening the ascent trajectory by about 11 miles and forcing an early turn.
This extra 30 minutes also gets tacked onto the "front end" of the westward stratospheric drift. The effect of this is to have the balloons drift about 14 miles further west than they would have otherwise. But there is another subtle effect caused by this data advancement. The balloons also get pushed back about a dozen miles further south. About half of this is due to the forced early turn which prevents the balloons from overshooting to the north by about 6 miles before the turn. The other half comes from advancing the point at 317 min. to the one at 232 min. In Moore's table, at 317 min., the balloons had drifted high enough to pick up a small component of velocity pushing them back to the south, in addition to the west. Moore advances this southward drift another 85 min. (317' - 232') by advancing his data points improperly.
Moore also quietly raised the average stratospheric wind velocities by about 10% over those of Flight #5. Like most of his other assumptions, he has nothing to justify this, other than wishful thinking. This too pushes the balloons a little further west and south during the stratospheric phase than they would have gone.
Trying to excuse the inexcusable(New 2010)
In a recent memorial honoring Moore's career (he died in 2010), debunker Dave Thomas and fellow debunker Tim Printy's Sunlite magazine, again tries to apply a propaganda spin to this mathematical nonsense, saying Moore told him this was just all caused by confusion in the way the publishers printed his table:
"While these calculations have been harshly criticized by David Rudiak, a discussion
I had just a few years ago with Professor Moore, before his health had declined too
much, bears directly on this criticism. And what Moore said was simply this: the
publishers of the Saler/Ziegler/Moore book mangled the table of values explaining
the MOGUL trajectory calculations, and mashed together alternating rows into single,
garbled rows of data. This explains much of the confusion which Rudiak has so
unfairly blamed on intentional malfeasance on Moore's part."
Yes, the table was printed in a confusing way. But this has NOTHING to do with the FACT that the calculation was totally fraudulent, as detailed above, or in any way explains the numerous other math "mistakes", even more coming up below. What we see here is just more deliberate deception and doubletalk from Moore defender Thomas, with Moore defender Printy giving him a forum.
It is also a new story from the ever-disingenuous Thomas, who previously said nothing about how the table was the supposedly cause of the problems. Originally in his 2003 Skeptical Inquirer article he wrote: 'I spoke with Professor Moore about all this on November 27th, 2002, but he didn't want to get into the math behind Rudiak's shrill accusations." Furthermore, I was "incompetent". So it was all me and nothing about the evil publishers "mashing" up his table. Now, apparently, I am simply "confused" by a confusing table, and Moore is still correct and completely innocent of wrongdoing.
I am certainly not confused by what Moore did. He cheated with his math, pure and simple. Trying to again shift the blame explains nothing away. I am also not confused that Thomas and Printy are continuing to lie about it.
More Moore Fuzzy Math
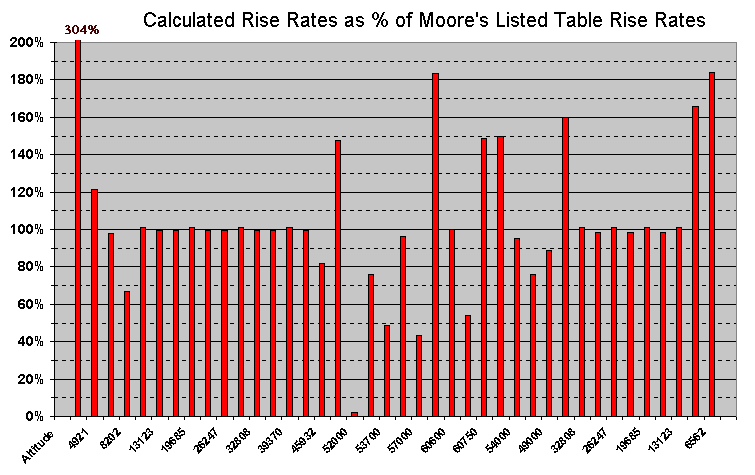
If this weren't already bad enough, Brad Sparks also noticed that Moore falsified many of his balloon rise rates in his Flight #4 table. (Sparks also e-mailed me that Moore's math was the worst he had ever seen, and I would have to agree.)
The second column of the table lists the rise rates that Moore said he was using. But when the actual rates are calculated (simply by dividing change in altitude by Moore's indicated change in time), the rates do not agree. Only one data point out of 40 used agrees exactly. If one ignores minor differences, still 19 out of the 40 rise rates disagree by 5% or more, 16 disagree by 20% or more, and 12 disagree by 40% or more. The single worst example occurs when Moore suddenly stops the rise of his balloon at the 52,000 foot level. Although his table value lists the balloon continuing to rise at 350 ft/min, the rest of Moore's table entries show it climbing only 100 feet in 12 minutes, or a rise rate of only 8.3 ft/min. This is off by over a factor of 40! Other hideous examples abound, such as his first rise rate as the balloon leaves the ground (852/2.8 = 100 instead of 304 ft/min). The calculated table value is over 300% of the listed table value!
Again, a "confusingly" printed table has NOTHING to do with it. There is absolutely no way to fix these outrageously absurd numbers, no matter how one plays with the table.
This is summarized in the following bar graph, where the calculated rise rates are shown as a percentage of the values Moore's said he was using. If Moore had calculated properly, all values should have been 100% straight across the chart. Instead, they are all over the map.
The trajectory based on Moore's table instructions (red) has been added here because the interpolation method with its extra data points only seemed to confuse the key issues. Some know-nothing, dishonest debunkers have tried to claim that the extra points in the interpolation somehow invalidated my calculation and validated Moore's.
However, the big point, deliberately skirted by the debunkers, is that when the table is calculated using correct mathematical techniques, including Moore's stated one, the trajectory ends up very different from the way Moore actually plotted it, including a big miss at the end. Thus using Moore's stated method, we end up with the 11 mile overshoot on the ascent side before the first turn, and the 21 mile overshoot of the Foster Ranch crash site on the descent portion. My original interpolation method actually underestimated just how different Moore's plotted trajectory was compared to the path he should have gotten had he done it the way he said he was doing it.
Another important point is that the balloon misses big-time, even with Moore's table calculated exactly as-is, and we have yet to deal with the fact that Moore also set up his table values wrong to begin with.Moore made his rise and fall rates much too high to drastically shorten the ascent and descent paths and prevent even more serious overshoot. As shown below, when we treat Flight #4 like a normally functioning balloon with rise and fall rates like that of Flight #5 (what Moore claimed he was doing but didn't), the overshoot of the Foster Ranch crash site is far worse than the above calculation would suggest (more like 70 miles instead of 20).
Furthermore, remember that Moore's instructions said he was carrying all velocities upward through the next higher altitude or layer. This is another key point, because it turns out that what Moore really did was carry velocities upward on the descent side of his table but downward on the ascent side. In doing so, he violated his own instructions and also destroyed the symmetry of his own table.
The Perfect Flight Assumption Violated
Because the Orogrande wind data only extended to 46,000 feet, Moore interpolated winds from the successful Flight #5 the next day (June 5) and spliced them into his wind model for Flight #4 above this level up to 60,000 feet. In fact, Moore implied that he was modeling Flight #4 after #5, even assuming that #4 was a more successful flight:
"I think that Flight #4 used our best equipment and probably performed as well as
or better than Flight #5." (p. 105)
I call this Moore's "perfect flight" assumption. Elsewhere Moore declared he thought that Flight #4 was very similarly configured to #5, implying the two had the same basic balloon train configuration and flight equipment (except perhaps for the replacement of radar targets on #4 for a radiosonde on #5). Overall Moore was stating or implying that Flight #4's equipment worked properly and should have behaved similarly to the successful Flight #5. One reason for this assumption was to justify his Flight #4 staying up in the air much longer than #5.
Moore also declared that he thought in, retrospect, the original plotting in Mogul records of #5's altitude to be flawed. He revised the track of #5 in the stratosphere (above about 52,000 feet) such that it rose smoothly until some of the balloons started breaking and the balloon train started to descend (compare the yellow plot from Mogul records with Moore's revised plot in black).
Moore clearly did model #4's stratospheric ascent after #5, following basically the same track, at least in his published table. (Compare red to black plot above 50,000 feet.) But when Moore ran his numbers, he pushed all his #4 data points back and destroyed the obvious correspondence built into his table between Flights #4 and #5 (this is one of the reasons Moore's math is definitely wrong).
Furthermore, the ascent and descent portions are very different, being much faster than Flight #5's. This would only have happened if there had been equipment malfunction, contrary to Moore's stated assumptions that #4 was similarly configured to #5, used their best equipment, and performed at least as well as #5.
The Missing Kink
Thekey issue is the "kink" in the ascent portion of #5 around 35,000 feet (either yellow or black plots). This was the point at which an automatic cut-off device released several large "lifter balloons," causing the balloon train to suddenly lose lift and dramatically slow its ascent. Even Moore's own Figure 1 for Flight #5 (p. 87), adapted directly from Mogul records, shows this and explicitly labels the lifter balloon cutoff..
However, Moore's model #4 ascent doesn't have this characteristic. The kink is completely missing (red plot). Moore's track has #4 speeding right through this area with its ascent rate unaltered and now nearly double that of #5. By having it rise faster through the upper troposphere, Moore enables it to shorten its exposure to the fast upper winds in this region that would have taken it much further to the NE than Moore deemed desirable. Study the above graph, and the time he shaves off the ascent amounts to "only" 20 minutes or so before the balloons begin to level off. This may not seem like a big deal, until one realizes that with winds blowing 50-80 miles/hour through most of this stretch, Moore has also shaved roughly 20 miles off the balloons drift to the NE.
What Moore did here was change his assumption in midstream. If the balloon equipment worked properly like on Flight #5 (what Moore said he was assuming), then Moore's Flight #4 ascent should have had lifter balloon cutoff, an obvious kink in the ascent curve, and a sharply reduced ascent after cutoff. But Moore eliminated this.
Like many of Moore's behind-the-scenes manipulations, his fast overall rise time is subtle and could easily go unnoticed in his tables of numbers (he provides no comparative graphs as I have done which would have made the differences more obvious). It is only with careful study that one realizes that his little changes here and there can end up having a big effect on the trajectory. By shaving off some time on one leg of the journey and tacking it on somewhere where, Moore ends up with a radically different trajectory than if he had played it straight. At the very least, Moore should have explicitly stated exactly what he was doing and given some sort of reasonable justification for it.
Balloon Drops Too Fast
Similarly Moore has #4 dropping much faster than any of the other three neoprene flights,even faster than the defective Flight #6 three days later (which Moore claims he was also modeling #4 after). This overly fast drop time also has very important consequences for the final crash site. Without it, the balloons would have badly overshot Moore's desired crash site, even assuming every other one of Moore's assumptions to be correct.
Again, this is completely contrary to Moore's stated assumption of similar configuration and equipment that worked at least as well as Flight #5. The Flight #5 profile (Moore's Figure 1) clearly shows additional "kink points" on descent. Moore's labeling of this figure indicates these points occurred where ballast was automatically dropped, one point being at about 33,000 feet and the other at about 25,000 feet. Despite 5 more balloons shown as breaking between these two points, the combination ballast dumps cut #5's descent rate in half, from about 800 feet/min. to 400 feet/min..
Even on the defective Flight #6,. Moore's own reconstruction (Table 3) shows a short-term, sharp drop-off at around the 25,000 foot level. (However, unlike Moore's labeling of ballast dumps on #5, it is unclear if this kink in #6's drop was also supposed to be due to a ballast dump). Although #6 fell much faster than #5, below the 40,000 foot level, Moore's own table never has the drop exceeding about 650 feet/minute.
But Moore's model #4 shows no descent kinks indicating the ballast dumps expected from properly functioning equipment. Instead he has the descent increasing to 900 feet/minute all the way to the ground. Again, it seems Moore is treating #4 on descent as being a defective balloon, just like he did on ascent.
Moore Improperly Advances the First Turn Point to Shorten Ascent
Also note the up and down arrows marked on the graph for Flights #4 and #5. The arrows mark the points in the stratosphere where the winds shifted direction and the balloons made a sharp turn. The up arrows are during ascent, while the down arrows mark the turn points when the balloons were dropping.
Based on Moore'stable for #5and obvious correspondence built into the table between #4 and #5 (Table 5, pp. 106-107), the turn point shown by the red up arrow should have been about 10 minutes before that for the real #5 (125 min. vs. 135 min.). (A minor point is Moore shaving a little additional travel distance along his ascent trajectory by cutting the table turn time by 10 minutes, but this might be justifiable.)
However, this is not the actual turn point Moore used when plotting his trajectory (Fig. 6, p. 102). Instead Moore improperly advanced all his table data points and destroyed his own Flight #4/Flight #5 altitude/wind data correspondence. The turn that seemingly should have occurred at 125 minutes got dramatically pushed back to the previous point at 95 minutes, as indicated by the red starred * arrow. Through his faulty use of mathematics, Moore cut an additional half hour from his ascent trajectory and forced an early turn.
Extra Time and Distance Improperly Added to Backward Drift
Overall, Moore advanced the turn point a full 40 minutes compared to Flight #5 (95 minutes vs. 135 minutes). Not only does this greatly foreshorten the northeast trajectory during ascent, it was also a way Moore secretly tacked on an extra 40 minutes of drift time back to the west on the "front end" of the stratospheric flight.
Also by having an overly fast drop time (and secretly adding extra time onto the flight before the balloons started to break), Moore tacked on nearly an extra 30 minutes to the "back end" of the stratospheric phase. [Mogul records show Flight #5 dropping after about 247 minutes of flight, whereas Moore's model has Flight #4 aloft for 396 minutes before descending. The difference is 149 minutes, not the expected 120 minutes Moore said he was adding by pushing the launch time forward by 2 hours into the night to avoid balloon-damaging sunlight. In order to finesse this, Moore resorted to the subterfuge of making the total flight time of #4 only 123 minutes longer than #5, the difference largely coming from the overly fast drop]
Through these subtle manipulations of data behind the scenes, Moore ended up adding over an hour of extra time to his westward stratospheric flight, secretly pushing it much further west than it would have gone had he stuck to his his stated assumption of #4's equipment functioning as well or better than #5's.
The black trajectory on the plot represents my first calculated trajectory presented on this website. It involves interpolation of extra data points in the big gaps in Moore's table (the extra points later used to model the flight after Flight #5). At lower altitudes, the wind data was averaged between successive points. At high altitudes, winds were carried up to the next higher altitude (the way Moore calculated winds for Flight #5, the winds then incorporated to model Flight #4).
As can be seen, the trajectory is very similar to the one one get's if using Moore's stated method of calculation, except the overshoot is slightly less (17 miles at the end instead of 21 miles). Both are scientifically and mathematically valid ways to calculate Moore's table.